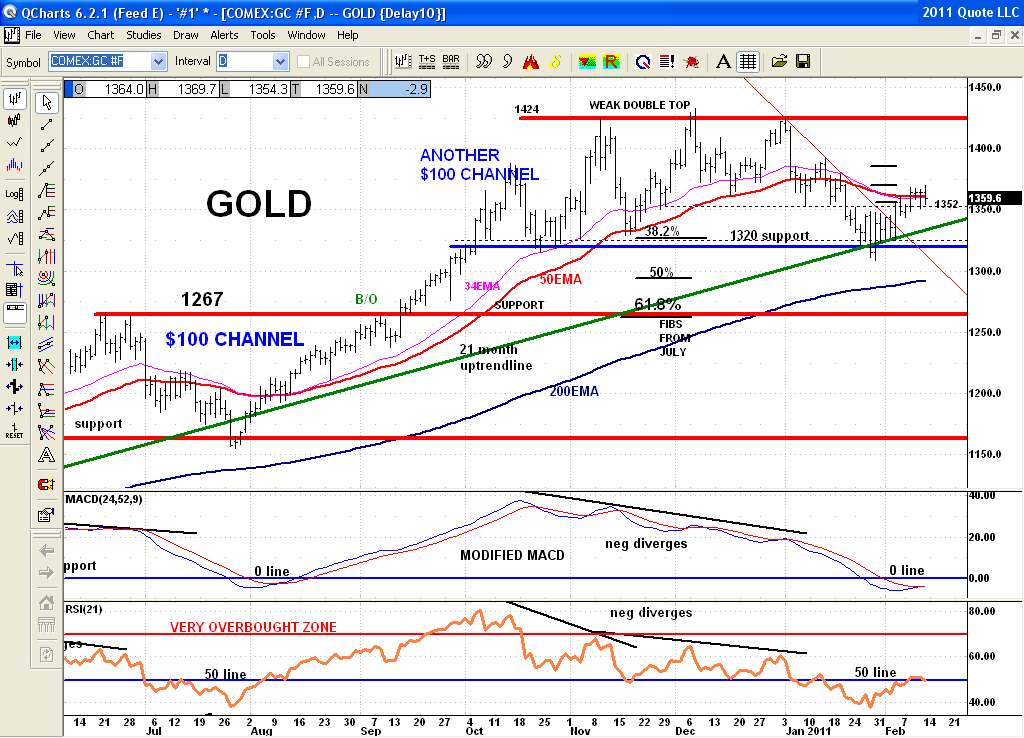
Gold broke up over its downtrendline and more importantly broke above price resistance of $1352. See price holding in a very tight range above this price resistance and trying to create support there for the last several days. This is very typical of a price breakout and tight consolidation for several days above before it rallies up sharply again just like my previous post showed on the tight range at the $1320 support that broke out sharply. Same thing once again. No guarantee of course but this pattern presently seen is a bullish pattern looking for a reason to move up sharply off new tested support. Only a clear sharp breakdown below $1352 would abort this bullish pattern. Look at the July & Aug lows and the lower technicals and moving averages patterns just like now. Same thing once again. And NO I am not a Gold Bug. They actually piss me off but hey, the chart is the chart and that is what I am observing fwiw..........Watch for a sharp move out of this tight consolidation range SOON.......