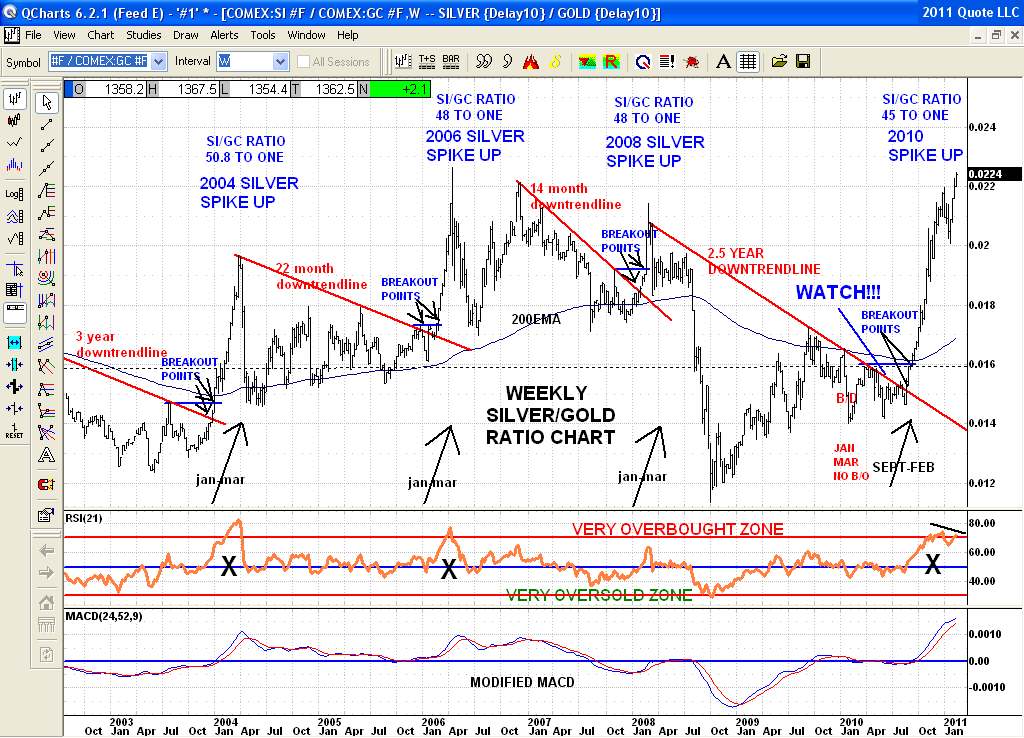
Here is the Weekly Silver/Gold Ratio chart again. So here we have a Silver rally relative to Gold in an even year much like the last few. Notice the downtrendline gets broken 1st at these even year points when the rally 1st begins. While this is a 'Ratio' chart it bests shows when Silver is starting a big rally by outperforming Gold. Just looking at the Silver chart isn't that revealing or timely. The SI/GC Ratio chart shows the momentum of Silver best. This breakout point is the place to buy Silver. See the latest breakout pt over the downtrendline in late August and then the breakout over the 1st price resistance pt in early Sept confirming the new spike has begun. Now the Ratio has reached previous pts of extreme of 45 to 50 to 1 in its run up spike so trading it from here is a coin toss. Price now is in whiplash territory and could easily plunge or continue from here or both. No easy trade from this point. The horse left the barn last Sept and is long gone. Good luck in finding it from this point.