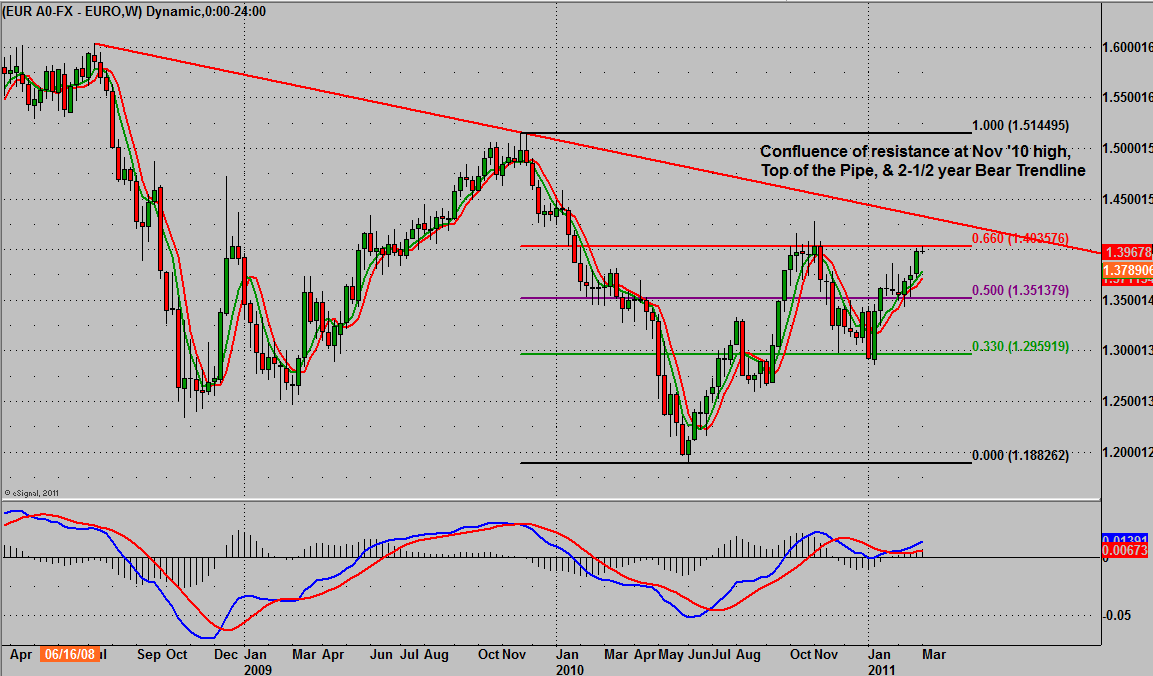
In Gann’s work the area on a price chart between the .375% and .625% retracements was called “the pipe” because of the two-tier price range the levels often create. In this chart however we chose the numbers 33% and 66% which give us the benefit of measuring the 66% retracement, which in Dow theory is the number to be eclipsed to signify a primary trend shift. On today’s chart the 66% level is 140.35 with today’s high at 140.36, and the 2-1/2 yr trendline intersect in confluence with the Nov ’10 high at 142.82. What this also reminds us of is that under Dow Theory the primary trend for EURUSD is still down if you use the ’09 high to the ’10 low. Interestingly if you used the 2008 high to the 2010 low EURUSD is just above the 50% mark for that retracement. One look at the chart over the past couple of years and it’s obvious a trader better know how to trade both sides – short and long –of the market.