I have always used the seasonal trend charts for an overview of high odds fundamentals. Just like summer time is likely to be the hottest time of the year seasonal trends in everything have a very logical bearing on everything including commodities and even stocks and do repeat or there wouldn't be such a thing as seasonal trend charts. I prefer the multi year time frame seasonal trend periods overlaid each other to catch changes if any. I use Moore Research seasonal trend charts for this. I don't think they would appreciate me posting these as it is a paid subscription site. I only subscribe now and again to get updated charts that are good for the year. But even these free single 30yr charts give the broad trend too. But seasonal trend charts give a good heads up on high odds trades and are one more tool to give you the edge like anything else that is better than a coin flip. Like anything else can be early or late or occasionally inverse in any single year but I wouldn't bet against them as a rule of thumb.
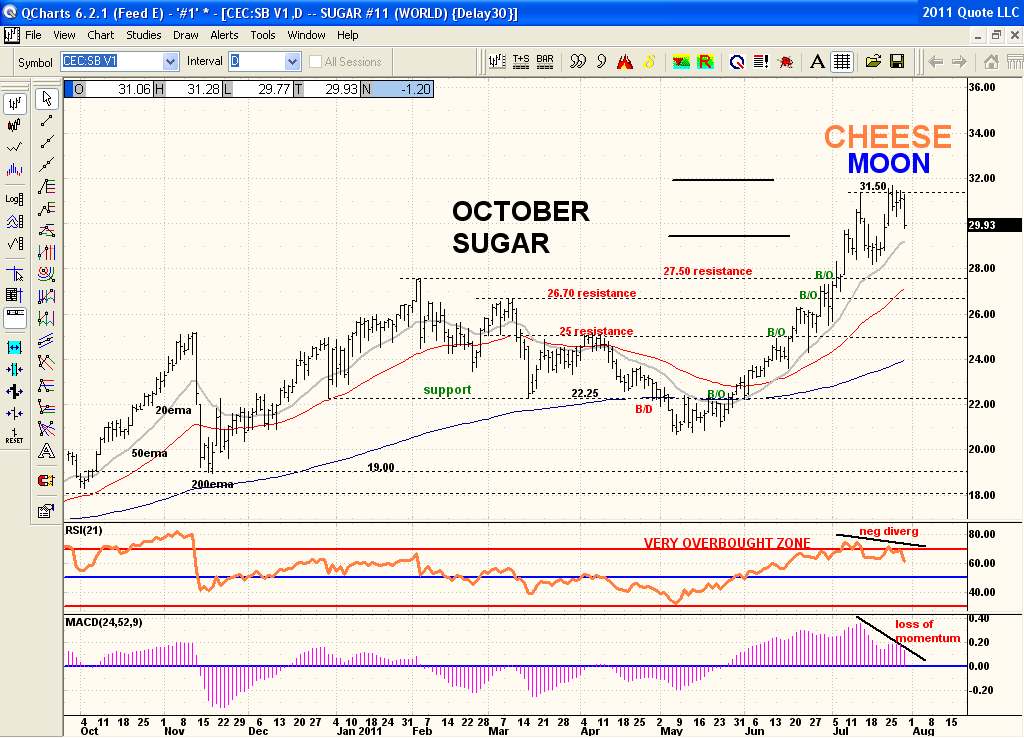
Lee: Here is the Daily chart of Oct Sugar showing the double top and bearish lower technicals that over not only in very oversold zone but showing a negative divergence on this double top. Plus the lower Modified MACD in Histogram shows the bearish loss of momentum as well. And the seasonal trend of strength is now over and bearish into late Sept. Also I have linked the seasonal trend charts LINK as well like I think you posted about.