Welcome to the TFC Commodity Trading Forum.
Please feel welcome to join in on these informative ongoing discussions about trading futures and commodities.

The Trading Forum is intended for the open discussion of commodities trading. The management of this Forum does not agree or disagree with the ideas exchanged, and does not exert editorial control over the message posted herein. Read and post at your own risk. The risk of loss in trading or commodities can be substantial. We discourage the use of this Forum to promote trading that is acknowledged to be risky. Please note: many links from the Forum lead to pages on other web sites. We cannot take responsibility for nor endorse the information presented on those sites.

TFC Commodity Trading Forum

Soybeans Part II of II *PIC*

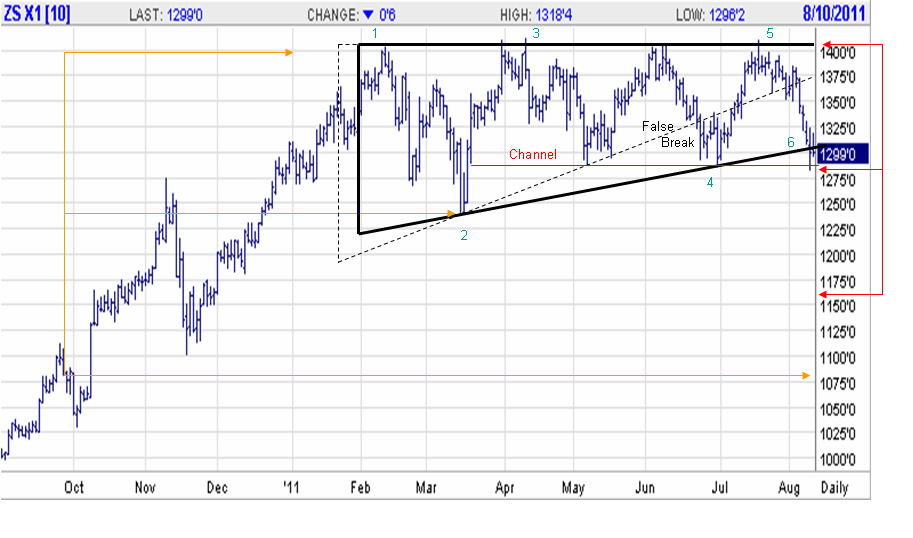
On the Nov chart it has formed more of right triangle. The current triangle is shown in bold black. The orange arrows show the projection from the height of the #2 point. The red arrows show a projection from what appears to be a channel.

Looking backwards I noticed what could have been considered a reversal triangle that is shown in black dashed lines that appeared to have a false break to the down side. With the heat wave this could go back up, and with the grain report out tomorrow I'll wait and see.