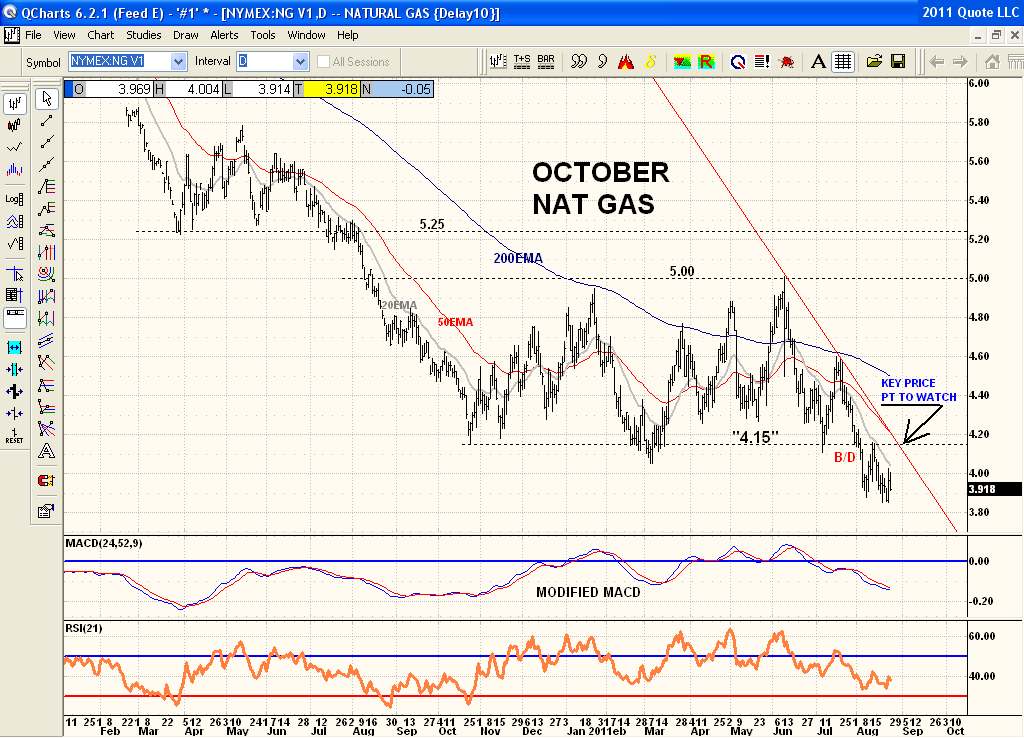
Here is a chart of Oct Nat Gas. See the importance of 4.15 on this chart. This was the Oct/10 low that was tested in March/11 and the bears could not break it down with any follow through. Prices then rebounded on the failed breakdown attempt and retested this level again in early July successfully establishing the importance of 4.15. Price did break down below this important support level in early August and the bounce back to it which served as resistance confirmed the importance of 4.15. This is a great price point to watch as it is the critical pt that needs to be cleared to confirm a change in trend from down to up again. That would also break above the downtrendline. Until price re-clears 4.15 on the Oct contract this chart is very bearish despite positive seasonals around the corner. Only clearing this price pt will turn NG bullish again. Price is king and this price resistance needs to be cleared to imply anything bullish. Until then it is a very sick puppy indeed. Also the October contract has the highest open interest but November is not far behind and then skip to January after that. So for now watch the October contract. While that doesn't leave much time for option trading the Oct chart is very close the the November contract chart. Seasonal charts show Nat Gas is typically bullish from the end of August through October with a brief pause the 1st 1/2 of Oct. While seasonals are not that timely they do give a good guide as to the season trend that historically reoccurs on the 5yr,15yr and 25 year charts.