Welcome to the TFC Commodity Trading Forum.
Please feel welcome to join in on these informative ongoing discussions about trading futures and commodities.

The Trading Forum is intended for the open discussion of commodities trading. The management of this Forum does not agree or disagree with the ideas exchanged, and does not exert editorial control over the message posted herein. Read and post at your own risk. The risk of loss in trading or commodities can be substantial. We discourage the use of this Forum to promote trading that is acknowledged to be risky. Please note: many links from the Forum lead to pages on other web sites. We cannot take responsibility for nor endorse the information presented on those sites.

TFC Commodity Trading Forum

Re: Corn/Long Term Chart/Lee *PIC*

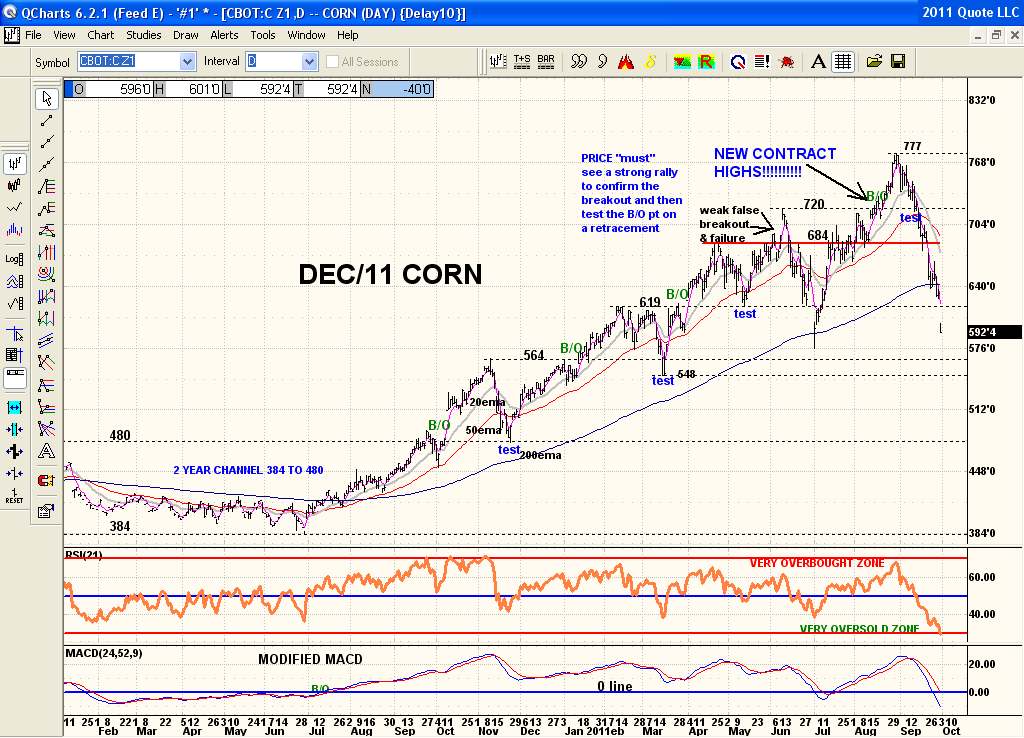
Well a closer look on a Daily chart of Dec Corn shows a recent breakdown. Historically Sept is the weakest month of the year for CORN and typcially sells off into early Oct like most grains. See the link to the seasonal trend charts on my previous post. But the chart now is bone ugly for sure. Price should find support at the July or even the March/Nov lows support areas. Notice the RSI 21 tagging the very oversold zone of 30 which is rare. That suggest a bounce is 'nearby'. But the price chart is just plain ugly and needs work.