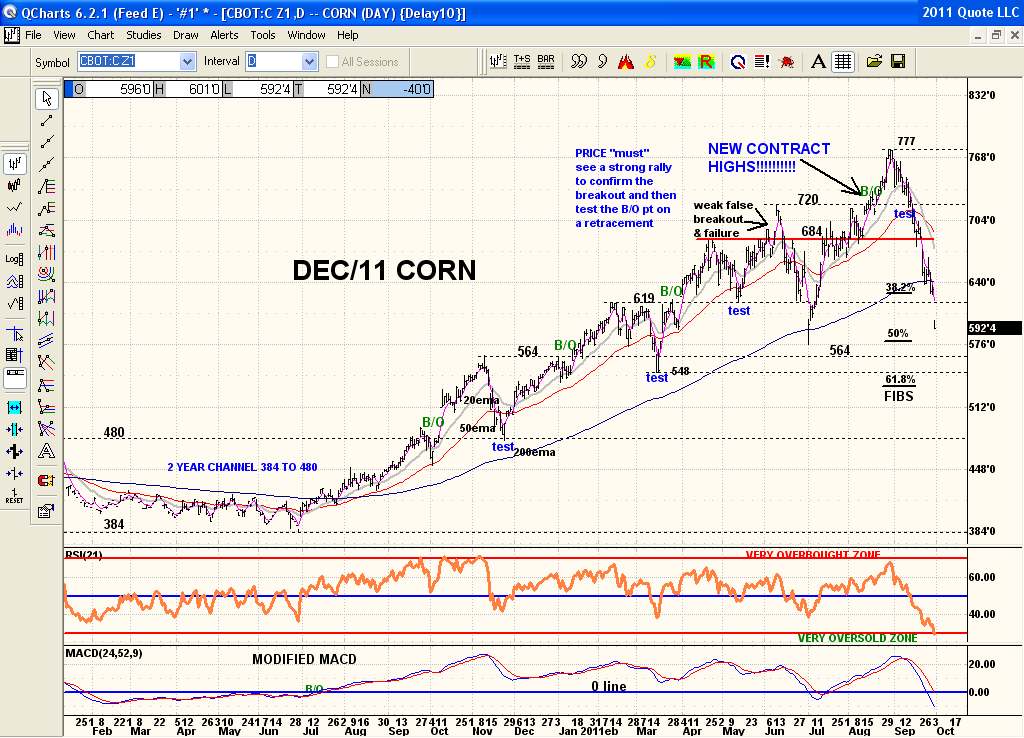
I was just stating what the chart was saying to me. I don't really have an opinion actually as I don't really care where it goes. But to clarify the RSI 21 has tagged the very oversold zone at 30 which is rare and shows a very oversold market. But looking at the price action price just broke down below 619 that has previously held as support and has a lot of history there as support. And it gaped down with a clear breakdown. So price action is bone ugly and shows everyone in the "run for your life the dams busted" mentality. And undoubtedly a lot of margin calls and more to come. So I wouldn't consider catching a falling knife here. I suspect price will find support close to the most significant support area of 564 where most of the previous support price action has been before. Not much activity at those two spikes down to 548. At that point the RSI 21 could become even more oversold. But it wont stay there for long and will bounce back with price as Corn contracts will be transferred to strong hands from weak hands. Looking at my Moore Research seasonal charts for CORN it shows a major low in all time frames of 5yrs, 15yrs and 30yrs at the end of Sept/early October and then a rally right into the spring of next year. That is the typical seasonal trend that it tracks historically. So matching up the seasonals with the RSI 21 and the washout taking place I suspect a low is close at hand. Where it is exactly is anyone's guess from here. But I do suspect it will be in the 564 price range not that the market cares what I think.
As far as Gold goes I'm expecting price to find support right here and rally again. And NO I'm not even a freaking Gold Bug,lol........... I just hate it when I feel this way about Gold....................But that's what the damn charts are telling me and I try to do what I'm told by the charts and screw everything else. The Gold stock ETF:GDX should finally outperform Gold this time and play catch up. But we'll see if that's what's next. I do think a big sea change is due right in the 1st two weeks of Oct that will blow the socks of many markets up and down.