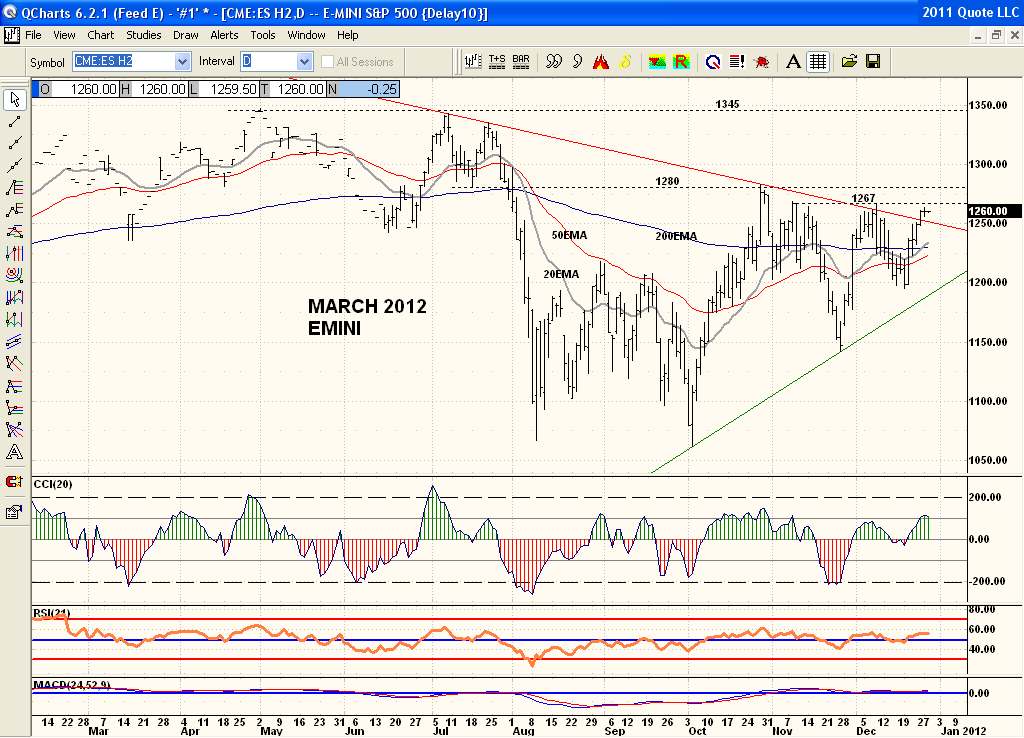
The Emini chart is a dog's breakfast since the end of July. It is displaying the financial mess in the world with its erratic price action for 5 months now. Technically the lows have been rising showing support coming in at higher levels which is bullish. And at the same time resistance is coming in sooner and sooner with those lower tops. Typical of a Symmetrical Triangle. This will be resolved either by the more bullish support buyers or the more bearish resistance sellers a those lower levels. No concrete support and resistance levels that stand out strongly. Price is now testing the downtrendline for the 5th time. It is also bumping price resistance at the early Dec highs resistance which is more important than an angled line. More important resistance is 1280 which is the Oct high which was the July low that broke down and price has already tested this breakdown resistance pt in Oct and failed there. So with the ES at 1260 there is significant resistance into 1280. Lower technicians are ok with the recent rally turning them postive. They are all above their center lines. And the rising 20ema is above the rising 50ema since late October. The one glaring negative is they are below the falling 200ema which is significant. Both would need to clear and hold above the 200ema to be a bullish setup of moving averages. While under the 200ema the moving averages are bearish other than very short term. Also notice all 3 moving averages are converging. Not a prefect convergence yet but this set up tends to be explosive price wise when seen as it doesn't happen often. See early August as an example. That's all I see with the chart fwiw. So with so much resistance dead ahead I wouldn't take a postion here so doesn't do me much good. Also the 1st week in Jan tends to be a complete basket case both up and down which can blow one's socks off either or both ways.