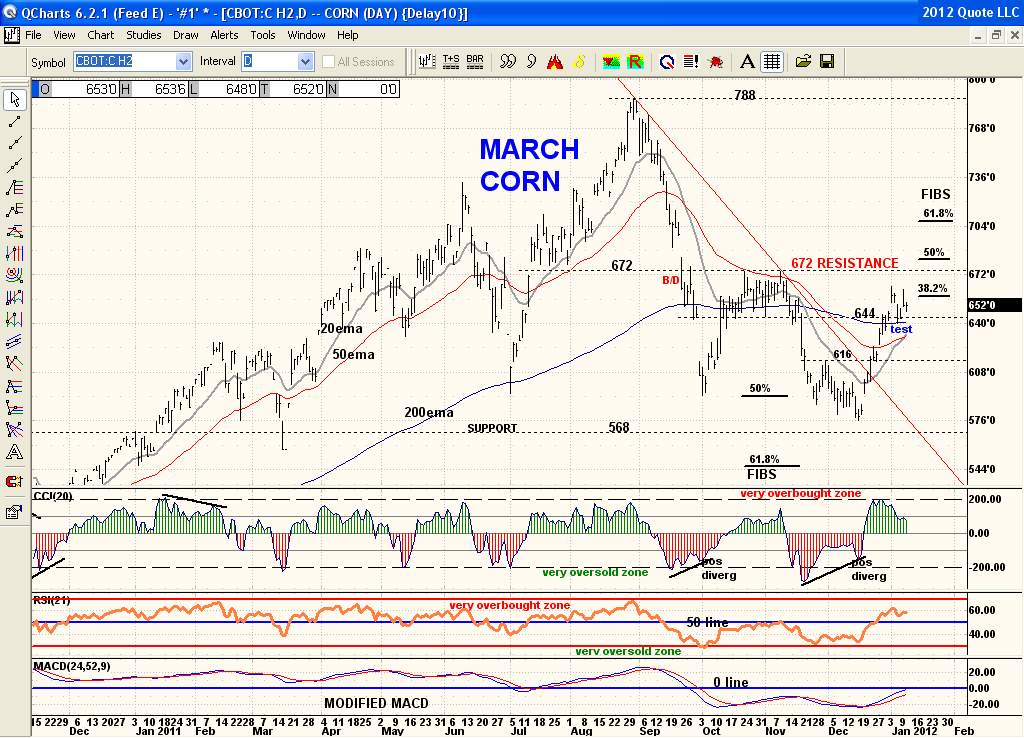
I've been posting this chart a few times now. And as previously stated price cleared 644 resistance and after a bounce up came back and successfully test this breakout point as support. Regardless price is still trapped in the tight price range of this 644 support and 672 resistance. A break of either price point will determine the next move. And the seasonal trend for Corn is historically bullish in the 1st 1/2 of the year. (see previous posts for further comments on the moving averages and Modified MACD,etc,etc.