I give up for now.
It seems if you type to the RH margin of the text entry box you are going to get long lines and have to scroll, independent of the width of any image posted.
This post should show the max. line length.
Lee
This is no doubt getting confusing, maybe just ignore it for now ....
Last chart was 1000px wide and all text fit w/out scrolling, now will type some fresh text and count the chars
1234567890123456789012345678901234567890123456789012345678901234567890123456789012345678
10 20 30 40 50 60 70 80 88
90
Here is last post - same text as last below the ======
But image now back to what it was of 1024px
I erred in my comment on not seeing a difference in the image size. It was about 10 percent smaller as it should have been - 1024 to 901 px wide.
I think this will require scrolling a couple of chars to view text.
Then I will reduce image to 1000 px wide. Should be enough to leave room for the text.
=========
Hi Trades,
Experimenting with your posts on text width and chart image.
Here is some old text that had to scroll a few chars to read to end of line.
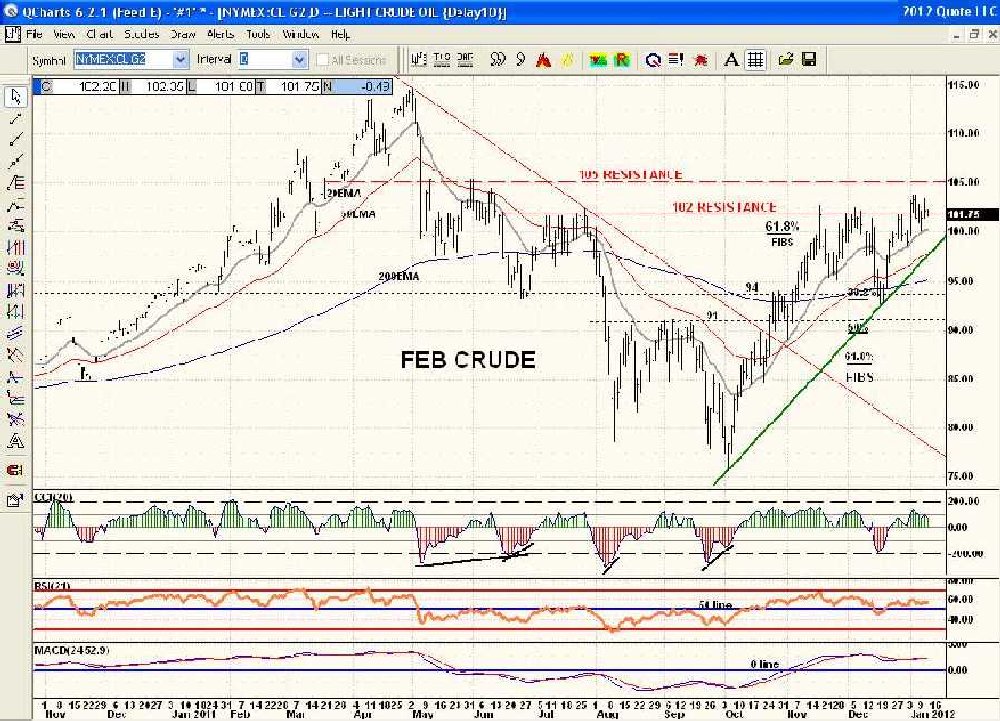
Feb Crude continues to bump up against the 102-105 resistance area after its test of 94 support. All moving averages are now bullish and this is the 3rd time up into this price resistance area which has chewed away much of the resistance. The pattern from the Oct low is a bullish Ascending Triangle. If price can clear and hold within the 102 to 105 area this would be especially bullish and suggest a strong breakout over 105. Meanwhile resistance is resistance.
Just copy/pasted it in the text box with no image yet and still have to scroll.
Now here is a reduced image of yours.
Original was 1024 px wide, now is 901 and I don't see a difference.
Nor do I have to scroll to read the text.
Will post this and compare to your last chart post for this chart - is still near the top of posts.
Lee
========
Ok was back to original 1024px wide image, still had to scroll 3 or so chars, no sense posting, will reduce image to 1000 px.