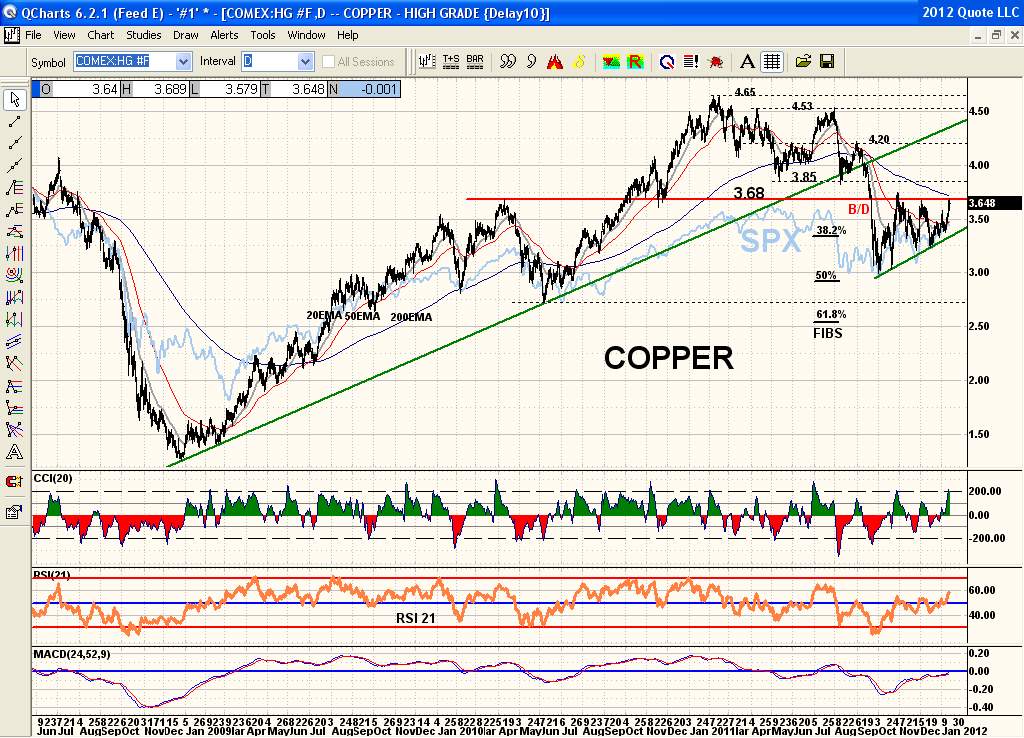
Here is a Copper chart from the lows in early 2009 to date with the SPX in Lt. blue overlaid to show the correlation. In Sept Copper broke down below the August and May lows as well as below the Nov/10 low at 3.68 that was a successful test of the breakout over the April/10 highs. Price retraced roughly 50% of the bull markets gains. Since selling off into the early Oct low price has been in a bullish Ascending Triangle coming back to this important 3.68 breakdown resistance point for the 3rd time. A breakout that holds above 3.68 would be very bullish. Meanwhile resistance is resistance and 3.68 is an important one. Price could typically pullback to its uptrendline once again before taking another run at 3.68. The SPX clearly tracks Copper as well. Note how Copper 'leads' and gives an early signal to what's next in the broad market. See the March 2009 SPX low and notice Copper made its low in Dec 2008 which was 'months' ahead of the SPX. That Nov/Dec low was the true low where you saw capitulation in the SPX and many other markets well ahead of March 2009. By March 2009 Copper had already begun its advance back to bull along with the major Copper stocks and other relative markets.