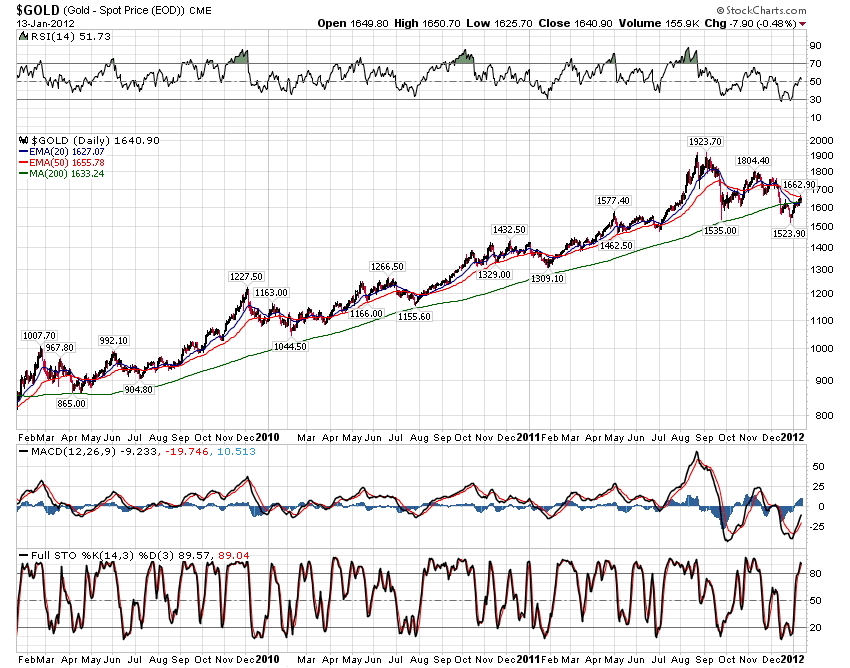
Hi Trades, yup, appreciate both the chart and comments. Good stuff as usual! I've been watching this current pattern develop as well. Looking back over the last 3 years on Gold, one can see some other good examples of this set-up. Bullion just seems to love this repeating pattern! The first obvious one was in early 2009 (1007.70 - 865.00). A second clear example began in Dec. 2009 ( 1227.50 - 1044.50). Those corrective patterns both ran about 2 months from high to low versus the current one that has developed over four months. There are a few other mini-ones in that timeframe that might be considered valid as well. Anyway, we shall see soon enough if the present bullish declining wedge resolves itself as successfully to the upside as past examples...I see Gold is on the march upwards tonite as I type this up...