Since December 2016, oil has been quiet, hovering between $50 and $55. This trading range is due to two factors. The first is upside pressure from an improving economy that has upped the demand for oil. In addition, OPEC's cut in production put a near-term floor under the price. The second is the downside pressure. At a price of $55, U.S. oil producers turn on their rigs, pumping tons of new oil onto the market and pushing prices lower. At $50, they shut them down. This is a downward pressure and keeps oil in a tight trading range.
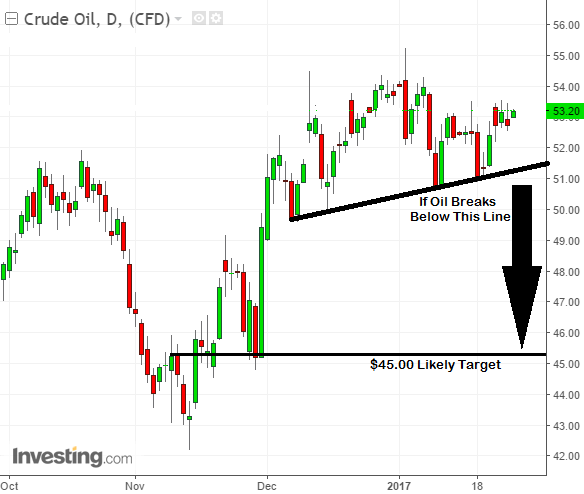
Based on the charts, oil has upside potential but it is on limited time. In other words, there is a triangle range that is shrinking quickly. Oil needs to break above $55 soon to surge higher. Based on the trend line seen in the chart below, if oil cracks $51.50, it will likely cascade sharply lower to a target of $45.00. Oil traders can buy oil on any break above $55 and can short oil on any break below $51.50.
Investors and traders analyze the commodity chart of oil