DIS is a pretty looking chart. All except for the gap over 120 on the daily...big gap. Would like to see that filled but that doesn't always hold. Sometimes they gap and run. leaving some in the dust.
But, whatever, it's all a crap shoot anyway. Pay your quarter and take your chances.
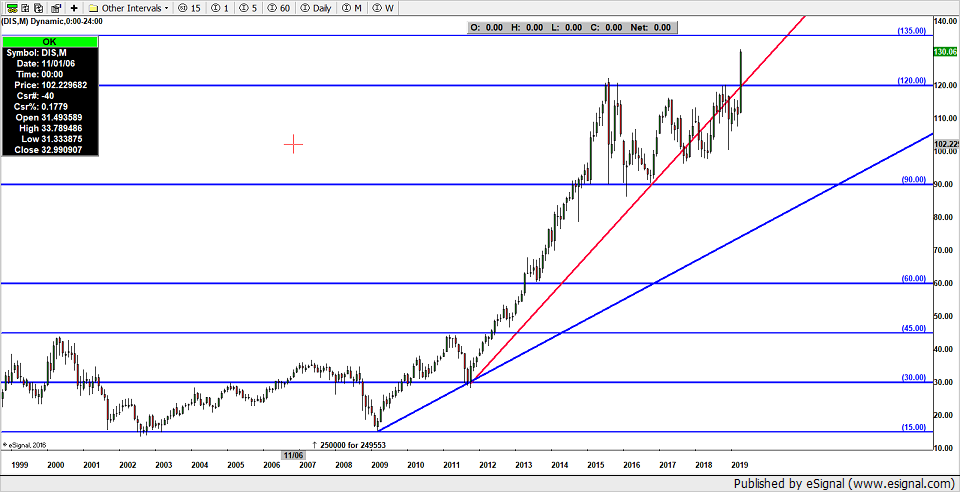
The red trendline represents up 90 in 90 months...the vaunted Gann 1x1 or 45 degree line. The thing that splits the thing in half...like the 180 degrees on a circle. Price above strong, price below weak. 90 months equals 7.5 years. 15 years equals 180 months. 22.5 years equal 270 months. 30 years equals 360 months. All tied together on the geometric clock, like that.
The blue trendline off 15 represents up 15 in 30 months. Up 1 in 2. the 1x2...the halfway point between flat and the 1x1.
Anyway, she likes to abide by the geometry. Look for resistance at 135 then 150 and on around the clock by 15's or 7.5's.