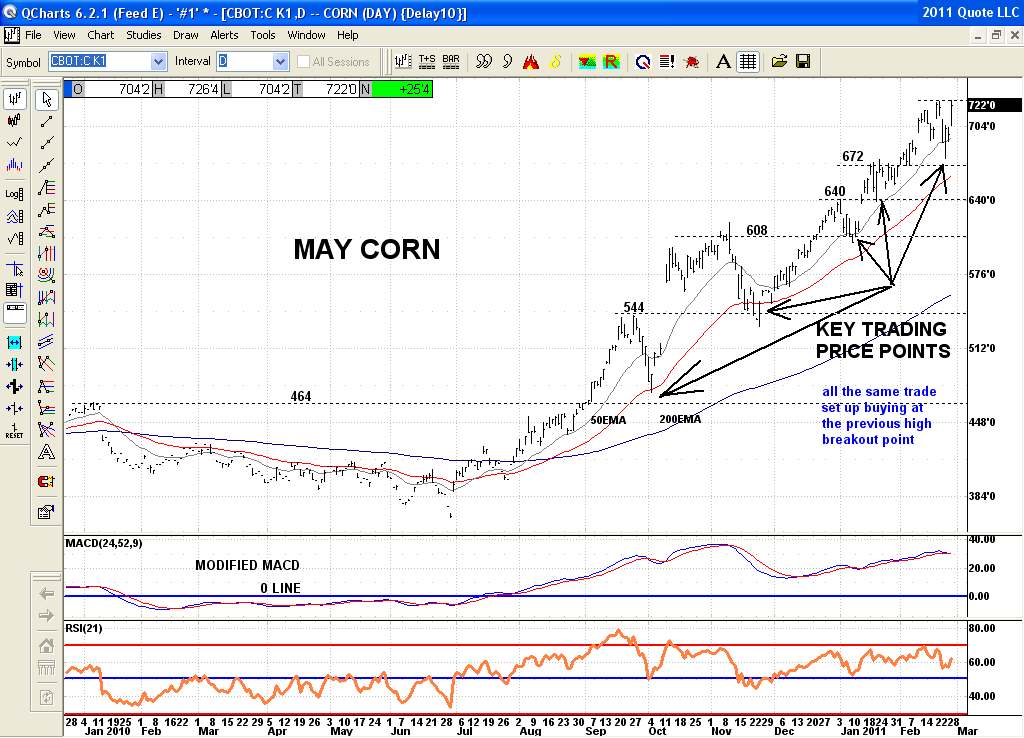
Well with Qcharts I just save them and update them. It's not like I have to put everything on them each time other than from recent data points. What is important to me is the support and resistance price points of previous highs and lows and I guess Fib percentage retracements somewhat. But those damn angled lines do serve as support and resistance and are meaningful when broken most of the time. Don't know why with them but accept that fact. I just use those as a heads up and look for the closest support and resistance line drawn in as the real buy or sell point. Those flat lines are where traders are getting in or out just like they did before. And computer programs and institutional traders are watching these pts to trade off of as well. And why not. They worked before so may work again. And when they breakdown and bounce back they are short selling points. That is the reason I put the horizontal lines on 1st and then the angled ones as well to watch for a break. But my original studies were "pattern recognition" and still is mainly so I know what you mean by just looking for what the chart is saying. But where to place that trade on a signal is why I draw the lines in despite the bullish or bearish looking chart. I guess fine tuning is what it is. Here is a Daily chart of May Corn. See the same setup each time at a price return to the breakout pt of the last rally. This is the main reason for me drawing horizontal lines on the charts. Doesn't work everytime just like May Soybeans but you almost always get a bounce up and a free trade from there to usually a double top at least.