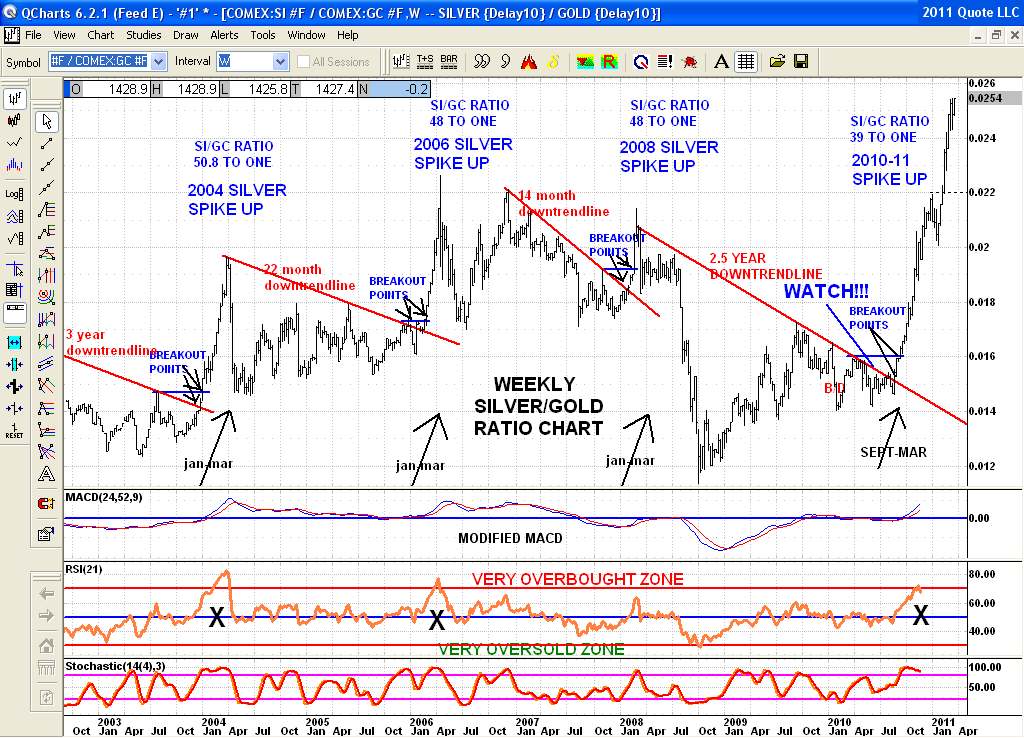
The Silver/Gold Ratio chart is still running up with the ratio now at 39.24 to one. Note on the chart when the 'ratio' breaks out over the downtrendline AND price resistance this indicates Silver is outperforming Gold and has broken out of its normal relationship and is about to run up again with a substantial rally above the normal noise level. This has been occurring every even year since 2004. Normally it begins in the spring but was late last year and started in Sept and is still running. This has been a very long run up in time and price. A sign of a top will occur when this ratio starts to increase rather than decline. In other words when Silver begins to underperform Gold that should be the end of the run up. Price after the peak has a habit of plunging sharply. Price then does not cross up over its downtrendline and start another run up of signficance for two years later,typically in even years.