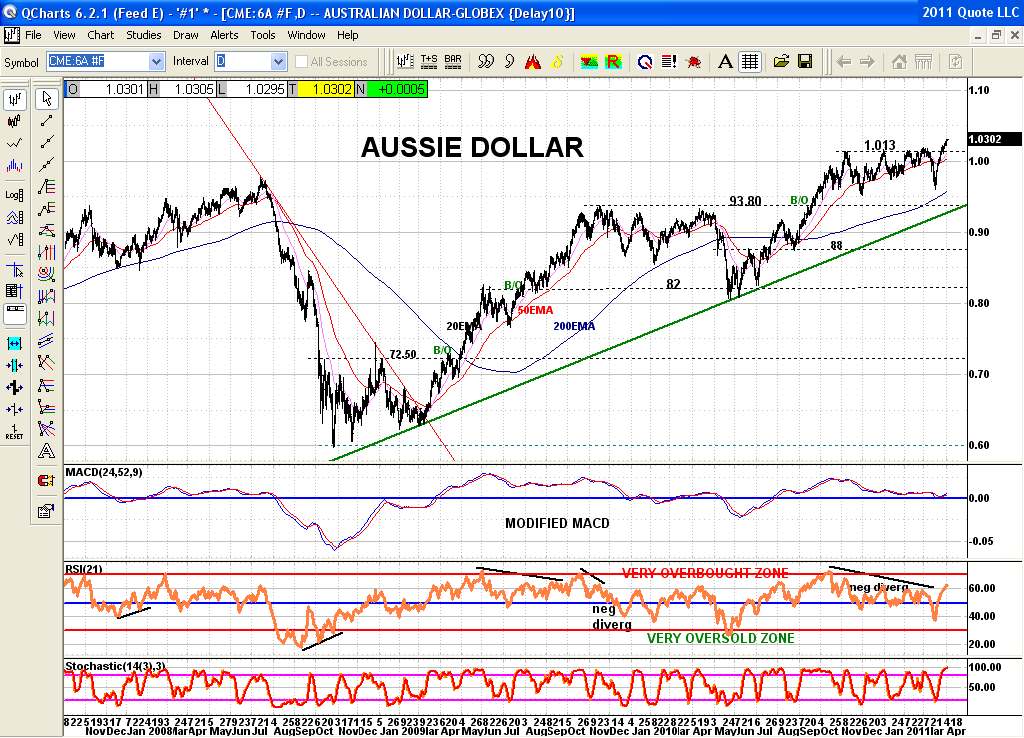
Well as Lee noticed AD has had quite a run up at least on the short term. Up 11 days in a row makes me question further gains and would suggest a pullback to the breakout point at 1.013. And that did jog my mind about the buy dates on April 3rd to 13th and how a few years ago I found those buy dates were being front run by about 10 days by smart money quite often. So hear we are again with a buy signal now and AD up 11 days in a row. Makes me say hmmmmmmmmmmmmmm. I like the chart. But price often comes back home to the breakout pt before she runs again too. I don't think I'd chase it but then I miss lots of good setups too as you might expect with that thinking. I just looked at my seasonal charts and see in all time frames the Aussie dollar has its strongest period of the year hands down from the end of March to early May.
Tell me something do you use Linear charts or Logarithmic charts most of the time?