Welcome to the TFC Commodity Trading Forum.
Please feel welcome to join in on these informative ongoing discussions about trading futures and commodities.

The Trading Forum is intended for the open discussion of commodities trading. The management of this Forum does not agree or disagree with the ideas exchanged, and does not exert editorial control over the message posted herein. Read and post at your own risk. The risk of loss in trading or commodities can be substantial. We discourage the use of this Forum to promote trading that is acknowledged to be risky. Please note: many links from the Forum lead to pages on other web sites. We cannot take responsibility for nor endorse the information presented on those sites.

TFC Commodity Trading Forum

Re: input on FXF chart and resistance levels *PIC*

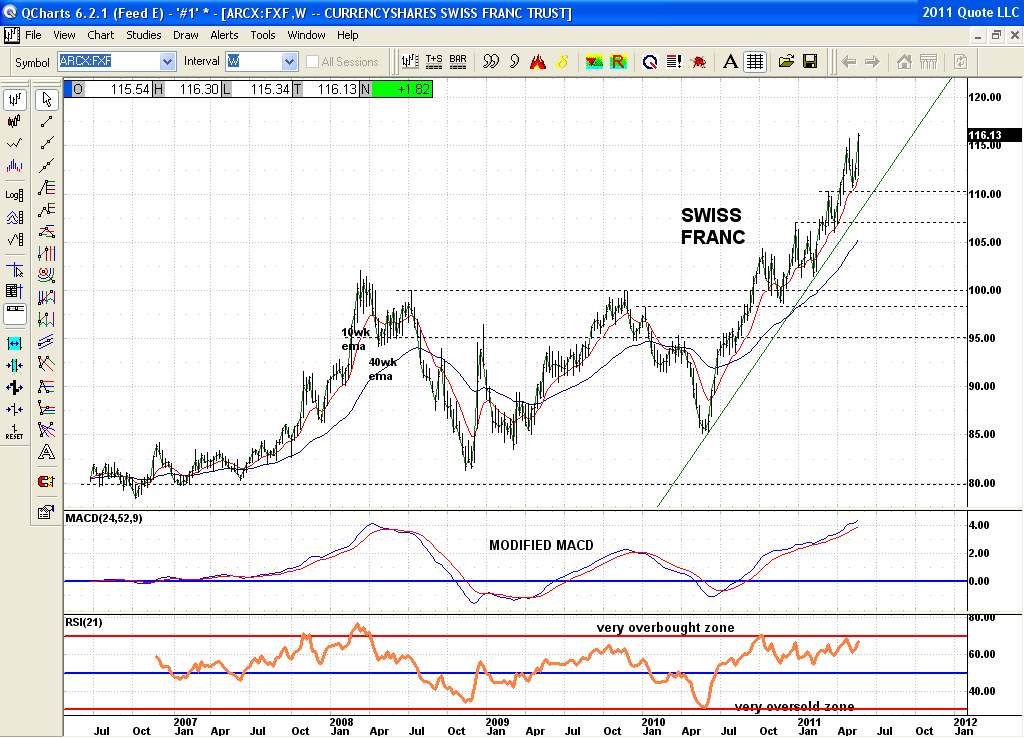
Well here is a Weekly chart of FXF with the 10wk EMA and the 40wk EMA. For a year now price pulls back to the rising 10wk EMA and previous high and finds support there and runs up again. It just did the same thing again at 110 and closed a Friday at new highs. Can't see anything that is about to change that pattern. But at the same time I wouldn't chase it and pay any more than the 10wk EMA price.

Messages In This Thread

Re: input on FXF chart and resistance levels *PIC*