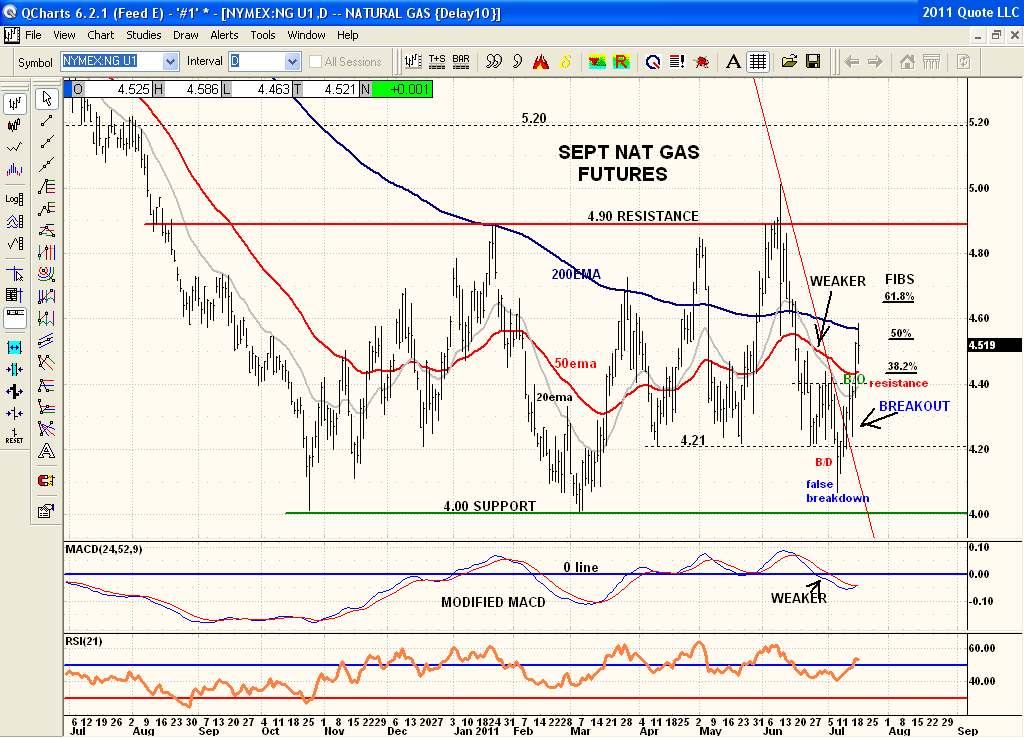
Here is the Sept Nat Gas chart again. Recall the 1st signal I marked 'weaker' awhile back. See the 20ema below the 50ema with price back to the 4.21 support then. That is why I marked that 'weaker' back then as the other times price was at support the 20ema was above the 50ema and using it as support. That suggested that the next bounce with price would be weaker and fail which it did. Price then did breakdown but the bears could not control the selloff further. Price snapped back sharply even on the breakdown day with a long tail on that bar if you look closely. The very next day price rebounded back to the 4.21 breakdown pt as the bears could not sell it off and had lost control. Recall that is when I posted the chart with the downtrendline showing and the 'watch for breakout or breakdown' comment on the chart as price was about to do one or the other decisively. Price broke out over the downtrendline as the price action had suggested it would and ran up to 1st resistance at 4.40 and backed off from there for two days. Note the day 'before' price cleared 4.40 the high tailed bar that showed the bears could not keep price down even at this resistance level. Price then blew through 4.40 and has run up to the 200ema again which has a track record of serving as resistance. That 'area' is also a Fib 50% retracement of the June to July selloff. Keep in mind Sept NG is still a bear and has been in a sideways channel for over one year now. The 50ema is still below the falling 200ema which means NG is still a bear and price action will act like a bear. So don't expect rallies to be exceptional and will tend to be just rallies within a bear market and well defined within a tight trading channel between 4.90 and 4.00. Good for short term trading up and down in short bursts of enthusiasm and pessimism until it becomes a bull again. The falling 200ema will at some point be crossed by a rising 50ema and turn this trend around. Then you will see price clear 4.90 and then 5.20 and become a bull again. Until then price is just in a tight sideways channel and still a bear and will act like a bear. Just thought I'd clarify my recent posts on Sept NG so you understand why I've posted each comment and make more sense of it collectively.