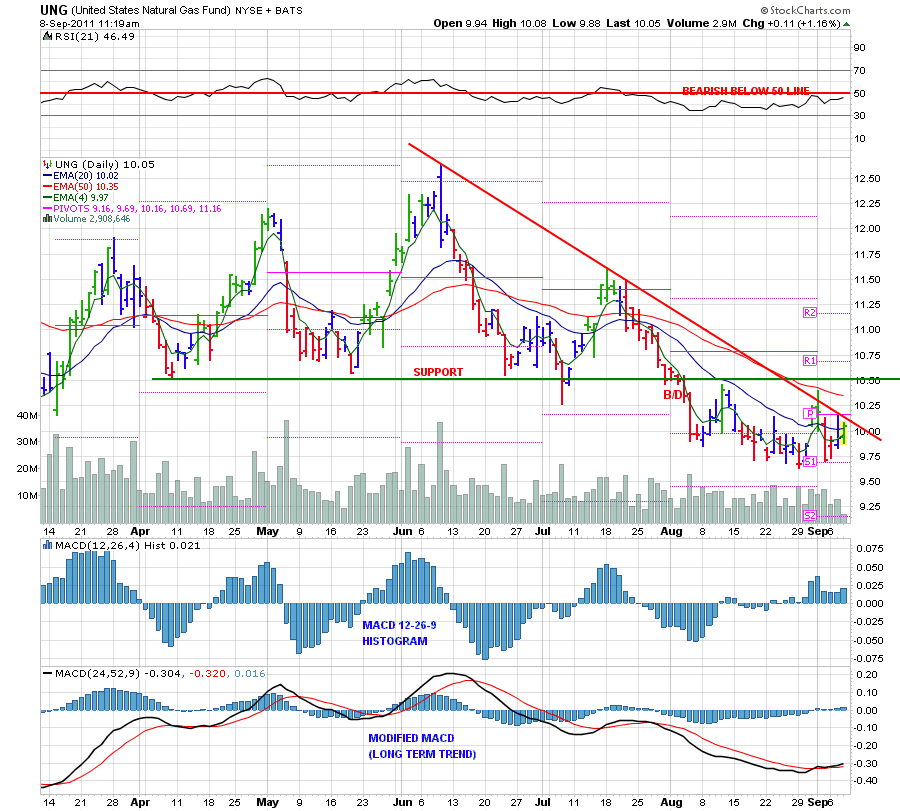
Here is a "Stockcharts Chart" of the Nat Gas ETF:UNG. I am using Elder Pulse Bars that show the postive and negative and neutral bars. Note the last bar is green which is a bullish sign of strength. Doesn't change the fact that price is king and must cross the downtrendline to suggest anything worth while on the upside. Also note the RSI 21 up to is still below the 50 line which remains bearish but diverging and stronger at the most recent lows.