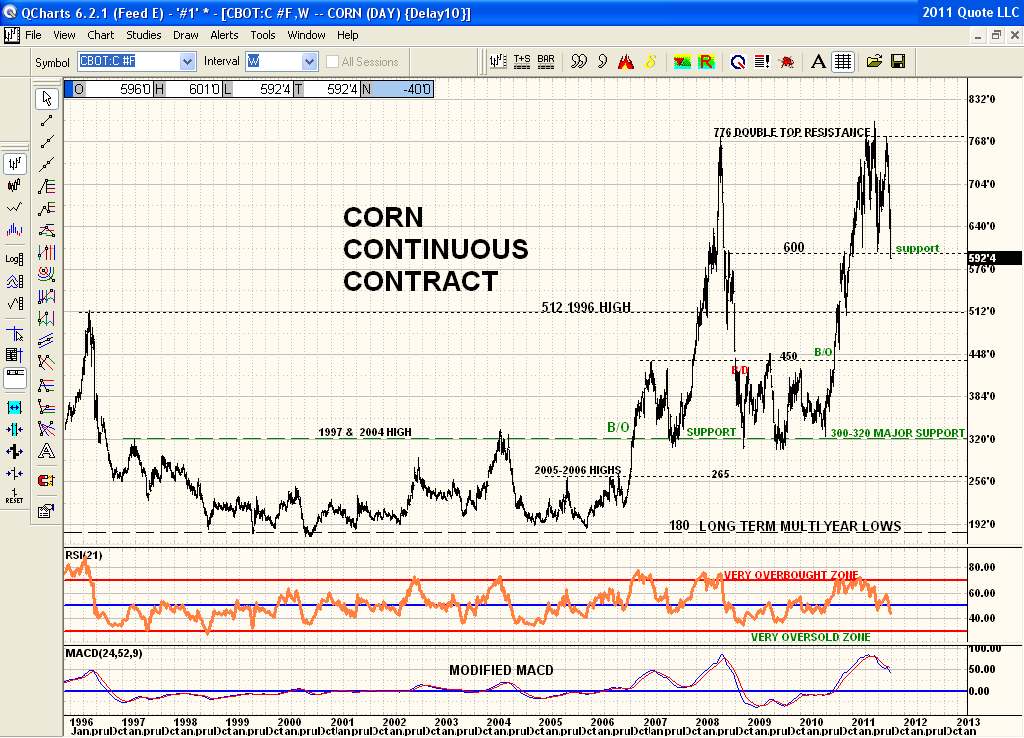
Here is a multi year Weekly chart going back to 1996 with some key price points marked for observation. Price at the 2011 support of 600 is being tested presently and needs to hold. Also added is a seasonal trend chart site for typical historical trend. This site also has all other commodities seasonals as well. There is only one long term seasonal trend chart unlike Moore Research that always shows a 5yr, 15yr and 25 or 30 yr overlaid to show any changes in each time frame but they do charge for the service and are not free like the single long term chart sites. But this single site gives the general idea much the same for free.