Re: Dec Crude/Testing Support/BernsteinSilverbear. *PIC*
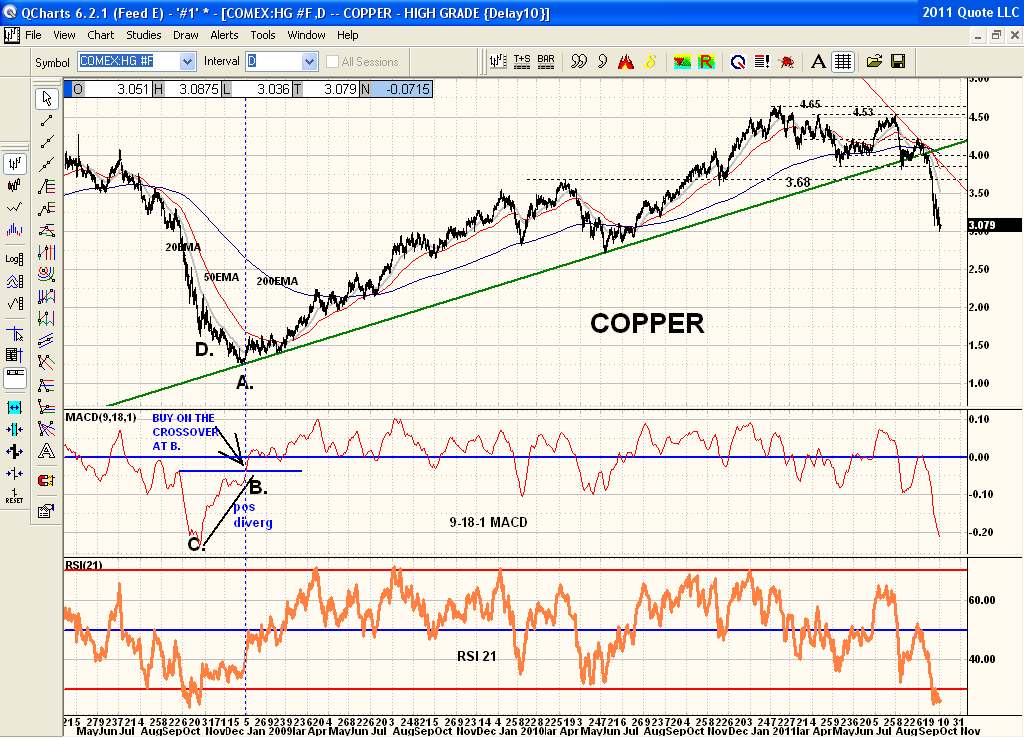
Here is another example of Jake Bernstein's buy set up signal. Rather than just seeing a positive divergence like this one on Copper at the bear market lows and buying a 'possible' price low he marks the price low at the divergence area as A. and then the divergence low on the MACD 9-18-1 as B. which is higher and determined the divergence. Then mark the previous low on the MACD as C. and then marks the previous low of price as D. The 'TRIGGER" for buying is not price but a crossover breakout of the last high point on the MACD much like you'd buy a breakout on a price breakout. So he doesn't go long just on a divergence which I can understand as often price will continue to selloff despite a divergence. Can be costly. So instead of price he uses a breakout over the horizontal resistance of the MACD line as that is a breakout of momentum. Combined with the divergence AND a breakout to higher highs on the MACD I can see that being better than just buying on a divergence that is questionable.
Also what I meant to point out is the similarity of the MACD 9-18-1 with the RSI21. Check them both out and see how the RSI 21 is more ragged and choppy but crossovers etc are the same as the MACD. I still prefer the RSI 21 as it has not only a center line like the MACD but also an overbought and oversold line which MACD does not have. I said before I would love to be able to create a moving average of the RSI 21. I called Qcharts long ago about this and they just didn't have that option. Something like Tradestation that allows one to create their own indicators could likely do this. But the RSI 21 is as good as anything I have ever come across. Above or below the 0 line to determine bull or bear works exceptionally well other than a market with extreme volatility or a sideways choppy market. No holy grail but haven't found anything better. When combined with a 20ema and 50ema both rising or both falling that is hard to beat to determine a trend.