Welcome to the TFC Commodity Trading Forum.
Please feel welcome to join in on these informative ongoing discussions about trading futures and commodities.

The Trading Forum is intended for the open discussion of commodities trading. The management of this Forum does not agree or disagree with the ideas exchanged, and does not exert editorial control over the message posted herein. Read and post at your own risk. The risk of loss in trading or commodities can be substantial. We discourage the use of this Forum to promote trading that is acknowledged to be risky. Please note: many links from the Forum lead to pages on other web sites. We cannot take responsibility for nor endorse the information presented on those sites.

TFC Commodity Trading Forum

Re: Trades - USD chart ?/Silverbear *PIC*
In Response To: Trades - USD chart ? ()

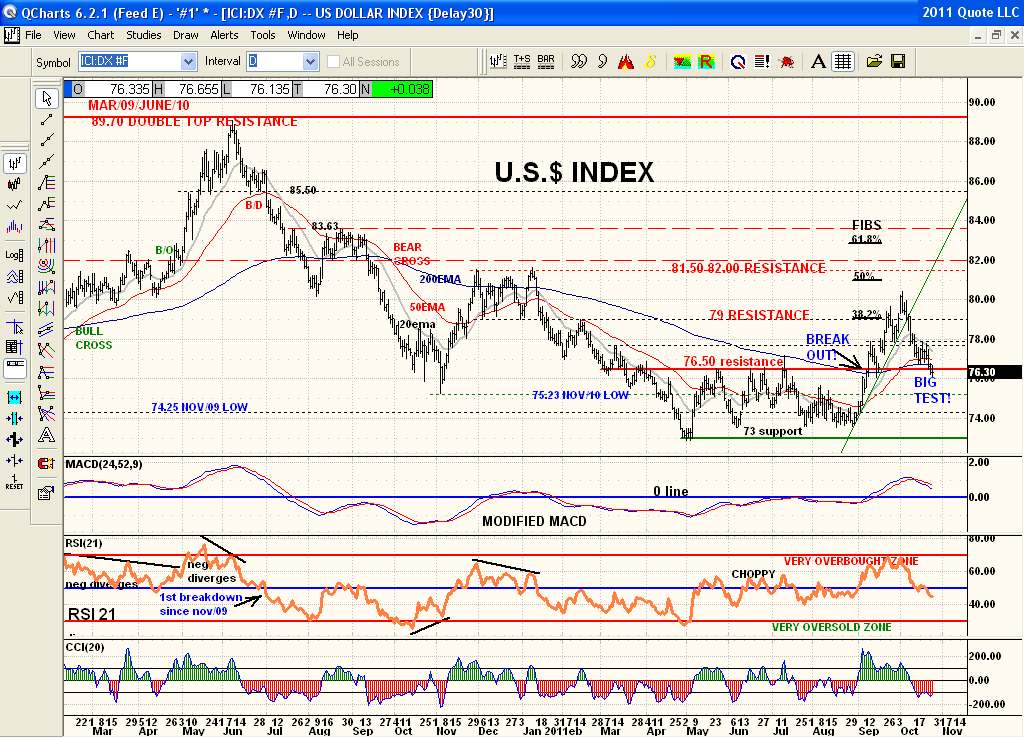
Here is DX once again. Since the channel breakout over 76.50 and the run up price has pulled back to the breakout point and is just sitting there. Gotta hold in this 76 area or that 50ema that just crossed up over the 200ema for the 1st time since last Oct will cross back down along with price and become bearish again. A report I came across awhile back said the U.S.$ has 16 year cycles and this last one ended on the most recent low. Previous cycles ended in 1995 and 1980. He claimed with his historical report that DX should have a multi year bull trend now.But that doesn't help short term. DX really can't drop below 76 support that it is sitting at and that to me is the acid test. That means EC should selloff now that it is bumping up major resistance at 139-140. That is the key for sure from what the chart tells me.

Messages In This Thread

Trades - USD chart ?
Re: Trades - USD chart ?/Silverbear *PIC*