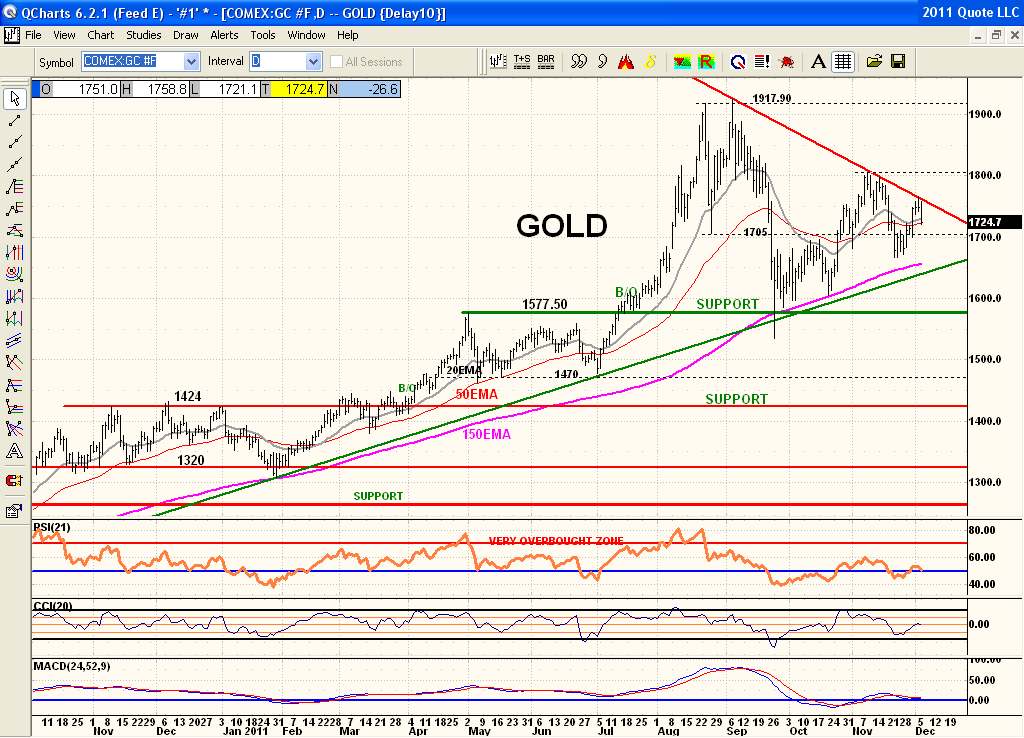
Gold continues to trade and respect its Symmetrical Triangle support and resistance points. Presently bouncing off the downtrendline resistance. Price has now reached the 2/3 to 3/4 point of the triangle where breakouts or breakdowns normally occur. The breaks tend to be strong as a rule. A Symmetrical Triangle while not suggesting direction of its break is a 'continuation pattern' which gives the odds of a break to the upside. With the trend being clearly up for years odds also increase the breakout will be to the upside. Not that the odds matters as price must prove itself. Even after a breakout over the downtrendline price still needs to clear $1800 resistance to confirm a valid breakout that would suggest at least a double top to the Sept highs if not higher. A break above the downtrendline would be a good 'heads up' on a price breakout. On the short term price continues to find suppport or resistance at the Aug lows of $1705 when above or below it. See dotted line. The uptrendline for the last year and 150ema that price has respected and bounced off of the last 9 times touched is around $1650 and strong support.