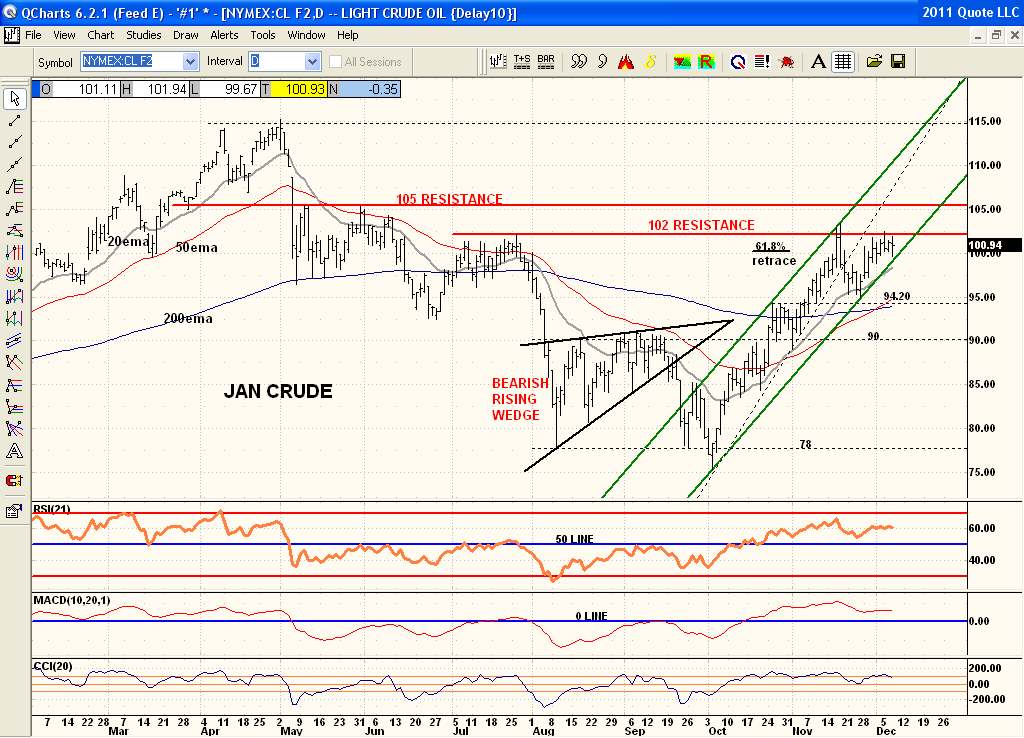
I don't know squat about that other stuff but this chart still shows serious resistance at the $102 area. The $102 to $105 price zone will be very difficult to clear if at all. Presently price is also at the Fib 61.8% retracment point of the May to Oct selloff. Seasonals are bearish into late Jan as well. I guess if it looks like a duck, charts like a duck and acts like a duck it is probably a dead duck that hasn't fallen out of the sky yet and a good short,lol.