Welcome to the TFC Commodity Trading Forum.
Please feel welcome to join in on these informative ongoing discussions about trading futures and commodities.

The Trading Forum is intended for the open discussion of commodities trading. The management of this Forum does not agree or disagree with the ideas exchanged, and does not exert editorial control over the message posted herein. Read and post at your own risk. The risk of loss in trading or commodities can be substantial. We discourage the use of this Forum to promote trading that is acknowledged to be risky. Please note: many links from the Forum lead to pages on other web sites. We cannot take responsibility for nor endorse the information presented on those sites.

TFC Commodity Trading Forum

Re: Trades / March sugar/Doc *PIC*

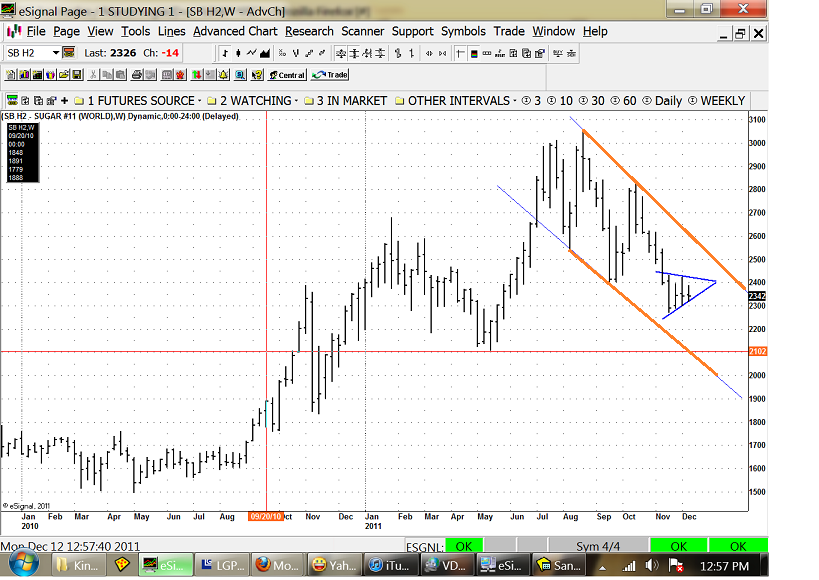
Here's something to consider, Gian. You have drawn a down trendchannel. Let's say we draw a trendline connecting AUG SEP lows, a confirmed downtrend, and run a parallel off the AUG high; we have a 'presumptive' trend channel. Under these circumstances the trader would look to sell at the high end of the channel, as occurred in OCT. Worked perfectly in this case, the so-called Wyckoff Reverse Trend Channel. The expectation is return to the lower boundary of the channel; failure to do so is a sign of strength.

The use of stats, Bollinger Bands, should serve you quite well. I would only suggest you incorporate several higher timeframes and watch for allignment of the various variables; it will reduce your trading frequency and thereby reduce drawdown. CO