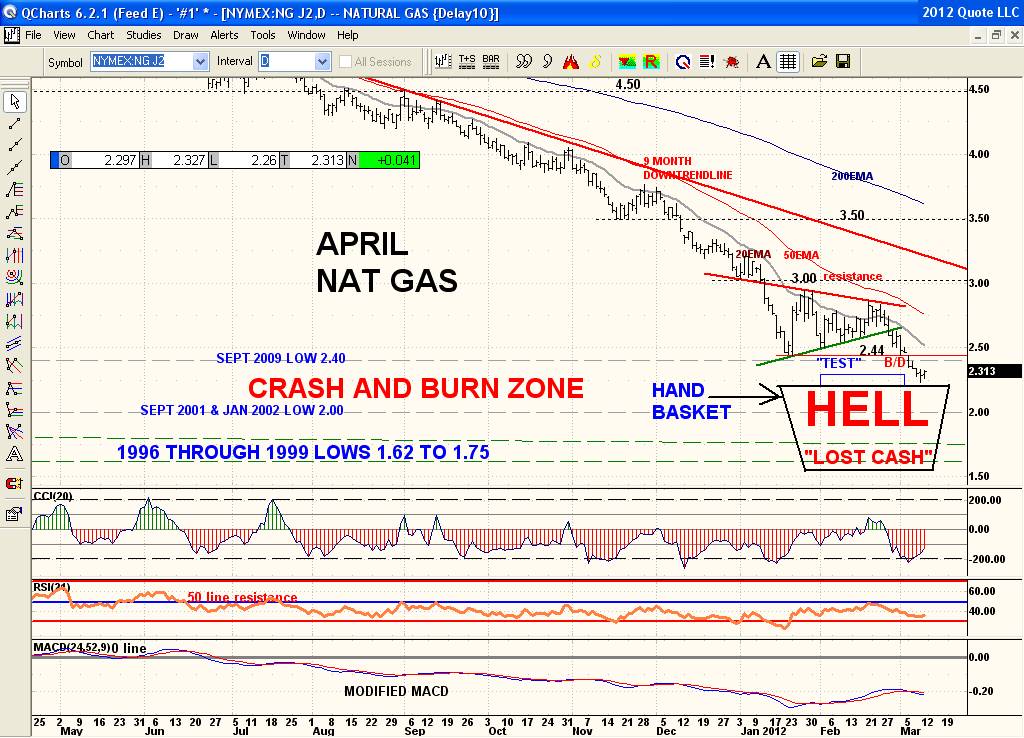
Nothing has changed as far as what the chart is saying. New lows beget new lows and that is exactly what has been happening. And the Symmetrical Triangle which is a continuation pattern did exactly what they typically do and broke down in the direction of the existing trend which was down. The double bottom Jan low of 2.44 also clearly broke down and price continues to hold below that level which is now resistance. The long term Modified MACD has once again rolled over and crossed down again. Only thing that could be construed as bullish is the CCI 20 which is very good at showing momentum short term and it is very oversold being below -200 and showing a positive divergence on the recent low. But in steep downtrends you often only get a dead cat bounce after as the trend is so definate. So technically price would have to re-clear 2.44 to even suggest a rally to its 20ema at 2.50,then 2.75 resistance and again at 3.00 resistance. Lots of concrete ceilings ahead for NG. It is still a bear and bottom picking can be an expensive game. Just look inside the Handbasket to see. There will need to be a base built at some point of which that typically takes a lot of time to build. Especially with the high supply of NG available. Capping wells doesn't mean that gas isn't available anymore from those sites. Don't mean to sound like a bear all the time but this is what the chart is telling me. If it looks and acts like a bear it probably is. A trader would be better to be buying new highs rather than new lows as the trend is your friend. Just think if you had shorted NG with the trend all the way down. I personally don't really care which way it goes myself as there are better fish to fry.