Welcome to the TFC Commodity Trading Forum.
Please feel welcome to join in on these informative ongoing discussions about trading futures and commodities.

The Trading Forum is intended for the open discussion of commodities trading. The management of this Forum does not agree or disagree with the ideas exchanged, and does not exert editorial control over the message posted herein. Read and post at your own risk. The risk of loss in trading or commodities can be substantial. We discourage the use of this Forum to promote trading that is acknowledged to be risky. Please note: many links from the Forum lead to pages on other web sites. We cannot take responsibility for nor endorse the information presented on those sites.

TFC Commodity Trading Forum

Aussie $ / Patterns Within Patterns *PIC*

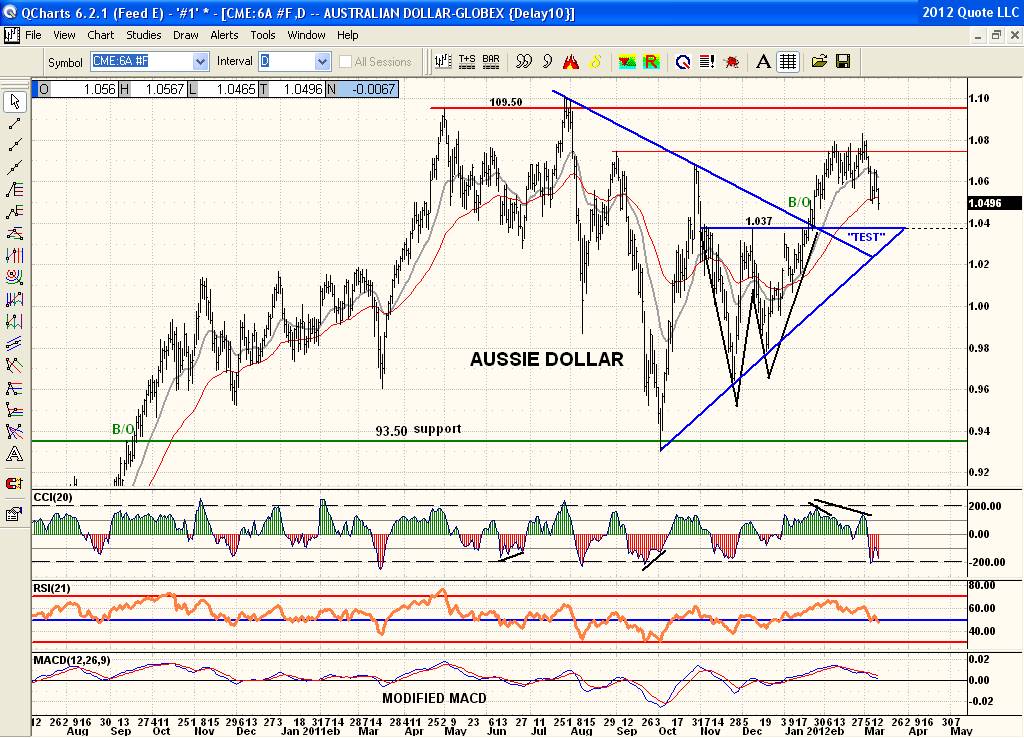
Here is an example of chart patterns within chart patterns. The Aussie $ from July through Jan has had lower highs but higher lows creating a large Symmetrical Triangle marked in Blue. And in Nov through Jan it also formed a "W" pattern in black which is bullish on a breakout above the top of the pattern. And from Oct through Jan price also formed a bullish Ascending Triangle also in blue with the same breakout pt as the "W" pattern. Price did breakout as the bullish patterns suggested and ran up to just over the Sept high. Price is now coming back to the breakout pt for a "test" of that new support. There are other patterns there as well but these are the major ones.