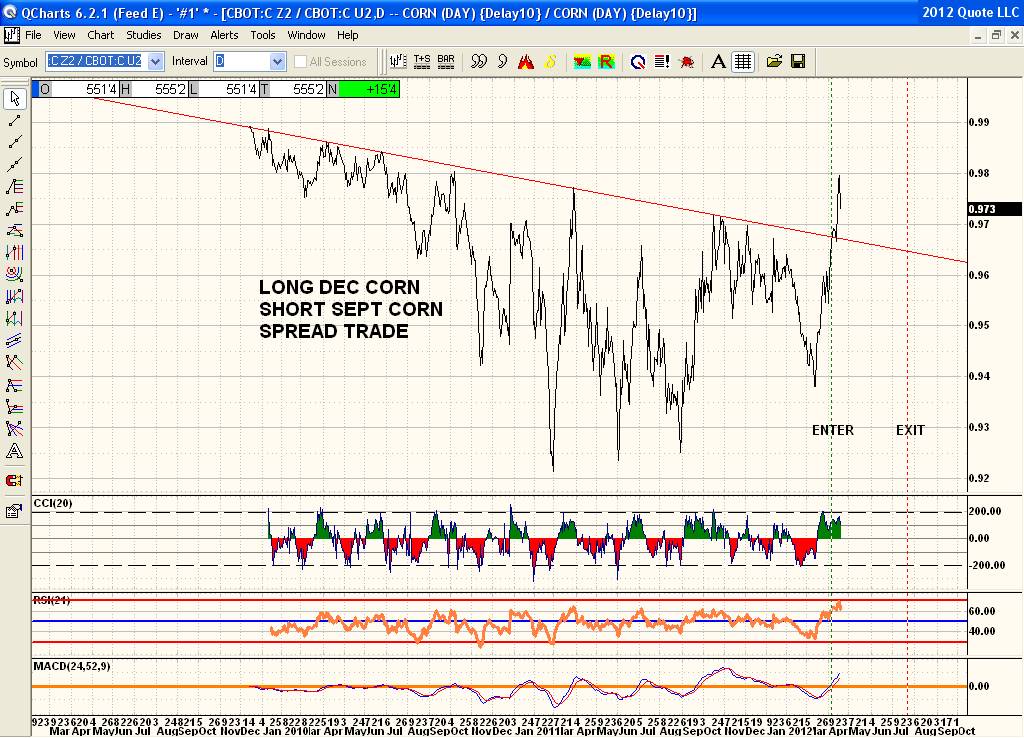
Here is the Corn spread trade that I posted which Moore Research sent me as an example of their work. It is the buy Dec Corn/Sell Sept Corn. This spread has worked 15 out of the last 15 years. I marked on the chart their Enter date and Exit date. As I said before i don't know what any draw down would have been during these previous periods in all those years as that can be an issue as well. So far this trade has typically started earlier than their Enter dates as I have often found but instead of pulling back as I expected seems to be continuing to rally through its resistance line. Previous price action suggests a strong pullback along the way even if this spread works out well as the spread does seem to be a high beta trade. Bit late to be jumping on this train now I would think. But a pullback to the resistance line well before the Exit date might be a buy point. You pays your money and you takes your chances. Moore Research has tons of these higher odds trades with a subscription as well as straight longs and shorts that have been successful at least 12 out of the last 15 years. Plus they have all the seasonal trend charts in multiple time frames overlaid to show trends in 5yr, 15yr 25yr and often 30 year as well which is nice to see. When all the time frames charted line up together when overlaid it is a good indication the present trends in a commodity are still intact and haven't changed.