Welcome to the TFC Commodity Trading Forum.
Please feel welcome to join in on these informative ongoing discussions about trading futures and commodities.

The Trading Forum is intended for the open discussion of commodities trading. The management of this Forum does not agree or disagree with the ideas exchanged, and does not exert editorial control over the message posted herein. Read and post at your own risk. The risk of loss in trading or commodities can be substantial. We discourage the use of this Forum to promote trading that is acknowledged to be risky. Please note: many links from the Forum lead to pages on other web sites. We cannot take responsibility for nor endorse the information presented on those sites.

TFC Commodity Trading Forum

Gold/S&P Ratio Chart/ Back to Support *PIC*

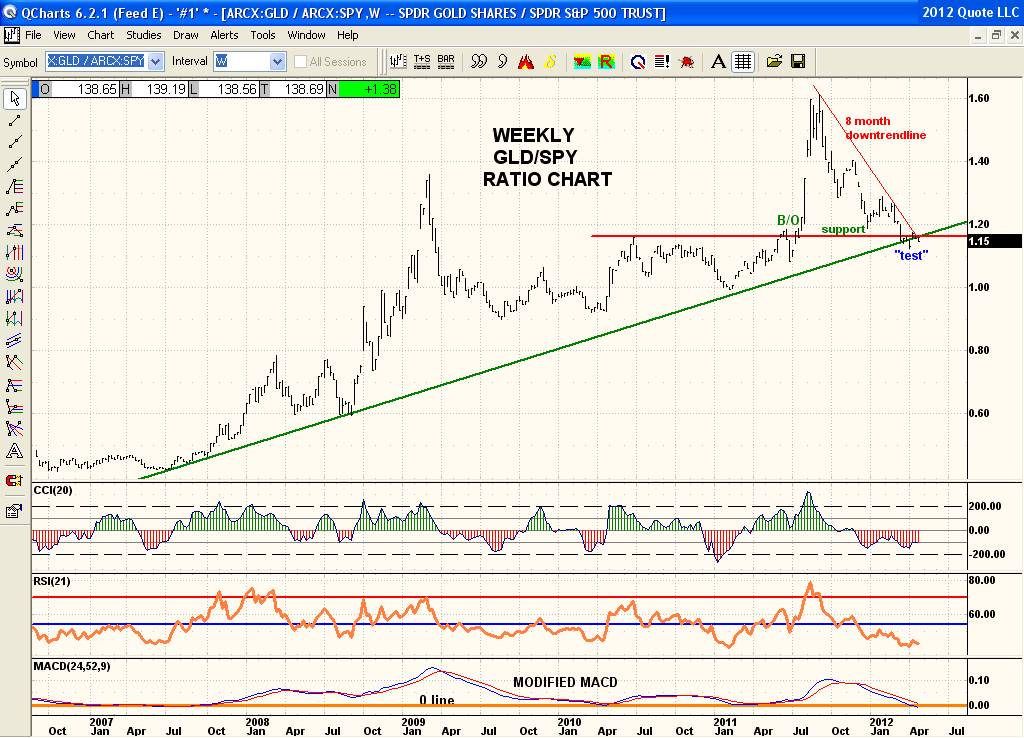
The GLD/SPY Ratio chart shows the multi month breakout in July 2011 and then a rally to the Sept 2011 high. Very typical price action after a significant breakout. The last 8 months this relationship has pulled back to the breakout point and is now testing this breakout pt as support. A failure to hold will suggest the S&P and other like markets will continue to outperform Gold. Breaking above that 8 month downtrendline that is in place will suggest a successful test of support and that Gold will outperform the S&P and other like markets. Ratio charts are good for indicating changes of one market to another. Keep in mind this is a Weekly chart and a Friday close is what's important each week far more than Daily moves.