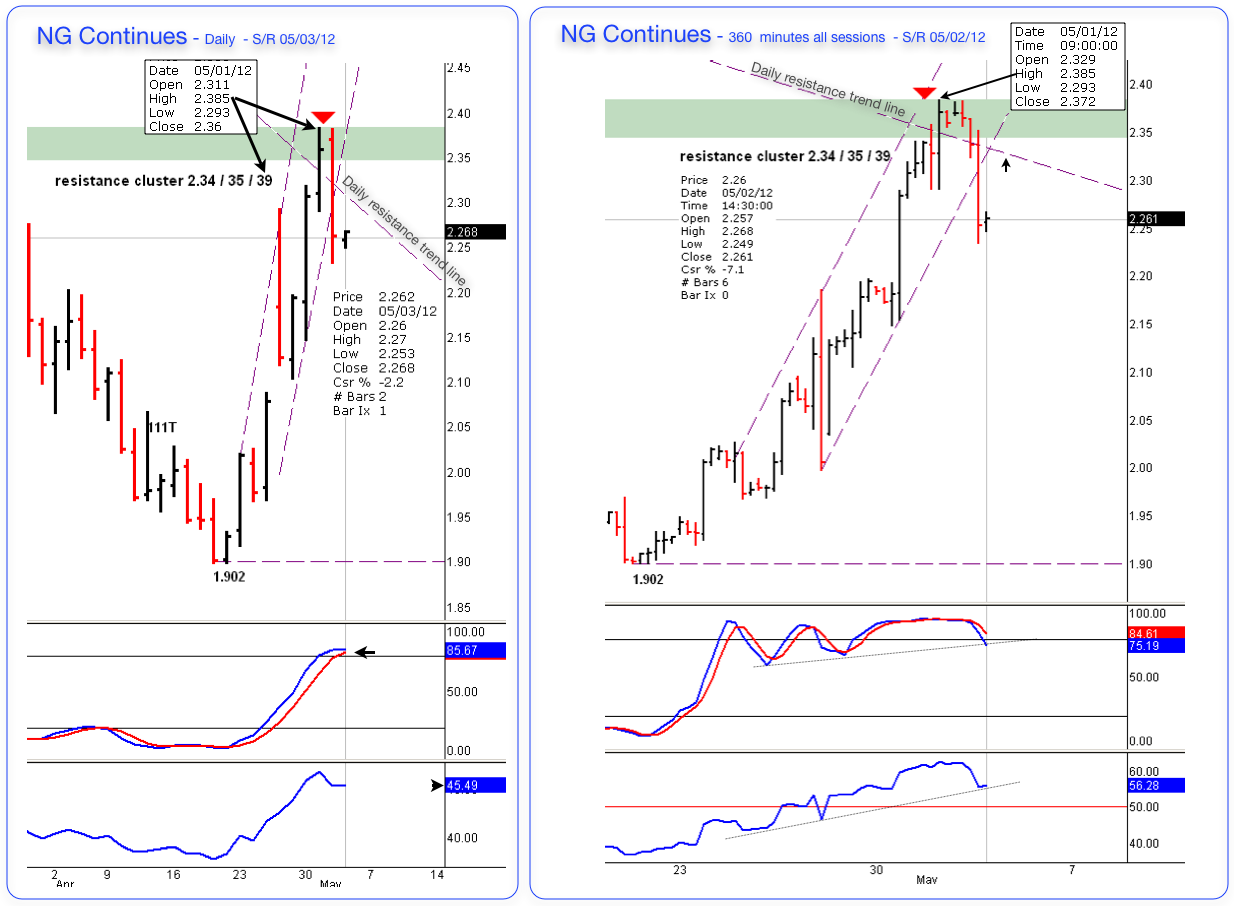
Below you will see 2 charts for NatGas, a daily and a 360 minutes charts. In my previous post I thought NG will be hitting a resistance cluster from 2.34 all the way up to 2.39 and a turning point the morning of 05/01/12.- On the morning of 05/01 NatGas did moved as high as 2.385 missing the 2.39 by 0.005 before starting to move down. I think it will moved up again and try the daily resistance trend line before resuming the down trend. Today NG gave me the money back I lent to the market via CL LOL
Trades, as always, has contributed to this forum with his charts and in depth analysis. I had no clue about fundamentals on this market, my charts are purely technical, but, it's good to know the seasonal behavior and other factors, plus Trade's charts are very detail!
Trades, thank you for sharing your great work and way of seeing!
G