"Maybe i have something incorrect, but 87 isnt showing as a fib on my charts."
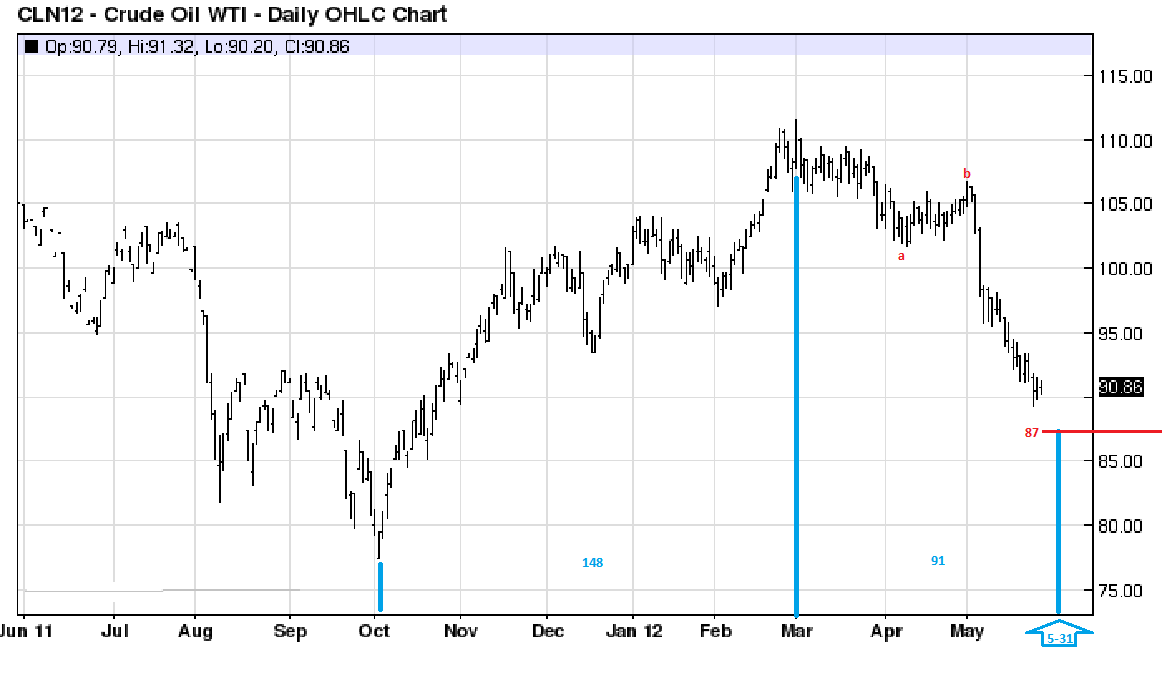
I don't calculate fibs in the conventional way that standard charting programs do. My 87 target is the 1.618 extension of wave A. I discovered that this method of calculation is more consistently accurate and reliable than the conventional method of calculation. With this method of calculation you are simply using wave A as a measuring stick and you calculate to discover the potential targets for wave C. It's a little trick I learned from Robert Miner's technical analysis course. It seems to work better than the conventional method of calculation, so that's the way I do it most of the time.
So, here's my math: 111-102=9, 9x1.618=14.56, 14.56+9=23.56, 111-23.56=87.43
This method usually will get within pretty close proximity to the eventual target of wave C.