Welcome to the TFC Commodity Trading Forum.
Please feel welcome to join in on these informative ongoing discussions about trading futures and commodities.

The Trading Forum is intended for the open discussion of commodities trading. The management of this Forum does not agree or disagree with the ideas exchanged, and does not exert editorial control over the message posted herein. Read and post at your own risk. The risk of loss in trading or commodities can be substantial. We discourage the use of this Forum to promote trading that is acknowledged to be risky. Please note: many links from the Forum lead to pages on other web sites. We cannot take responsibility for nor endorse the information presented on those sites.

TFC Commodity Trading Forum

U.S.$ Index/Continues its Pullback *PIC*

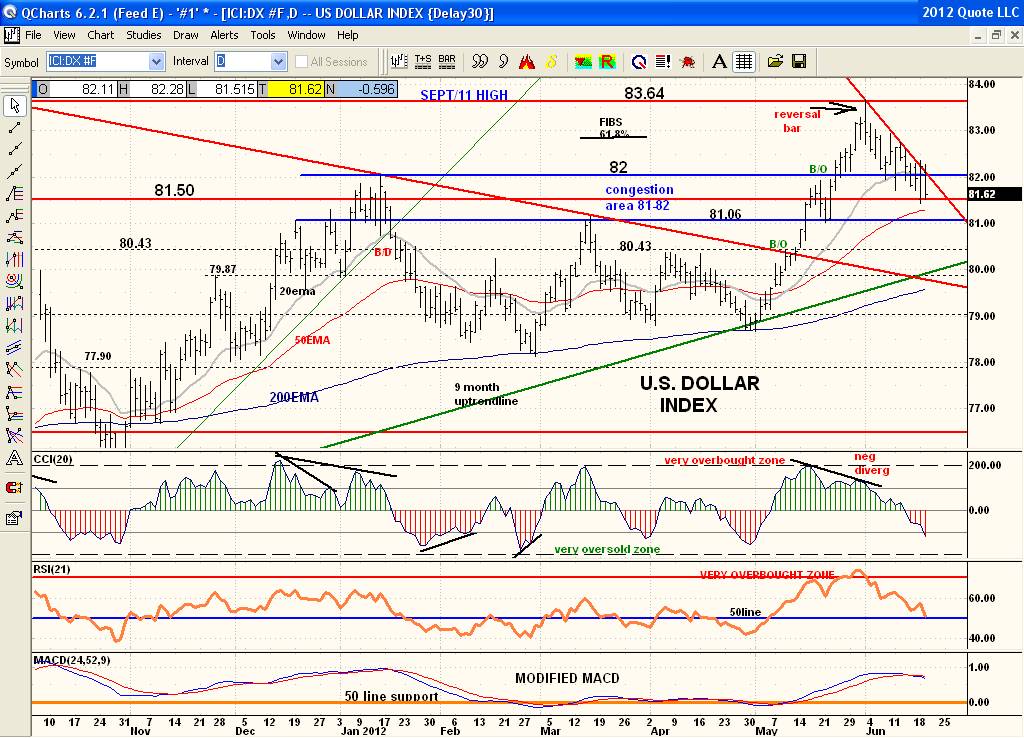
DX topped out at its 10 month double top of Sept/11. Technicals were very overbought and showing negative divergences at this double top of 83.64. The day of the high price closed with a bearish reversal bar that started the downtrend. Price continues to zig zag down in an orderly manner and back into the old congestion area. Price could pullback to 81 to 80 with inverse markets continuing to rally.Keep an eye on the downtrendline. While this angled line like most downtrendlines (or uptrendlines) are only a 'rate of decline' or 'rate of incline' and not actual price resistance or price support they are a good guide on 'price direction continuation' or 'price direction change'. Seasonal trends for DX in various time periods are bearish from mid June to mid July.