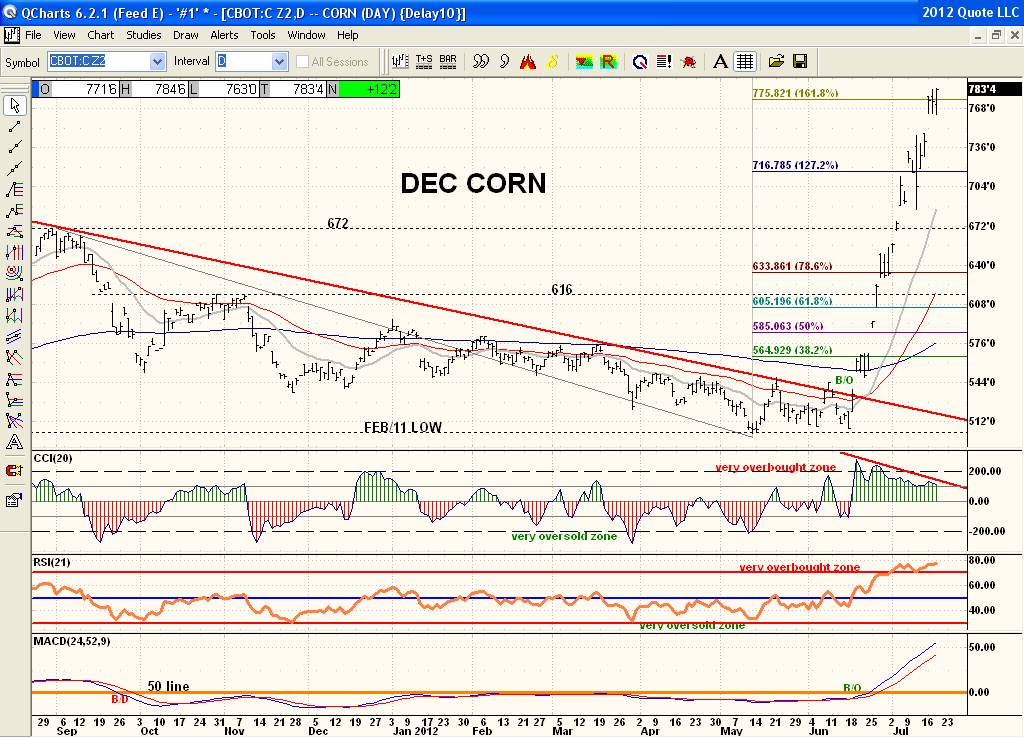
Ok, this is a better, clearer chart of Dec Corn from the previous peak. I got rid of some of the Fib numbers too as it was getting too cluttered and the major ones are left on. You can see the simple breakout above the 9.5 month downtrendline was a good basic techncial buy signal along with the Modified MACD doing the same above its 0 line. And since then a breakaway gap up and then runaway gap after. You can also see the loss of momentum with the CCI 20 recently as well. But draw your own conclusions as always. For intraday trading this Daily chart may not help much.