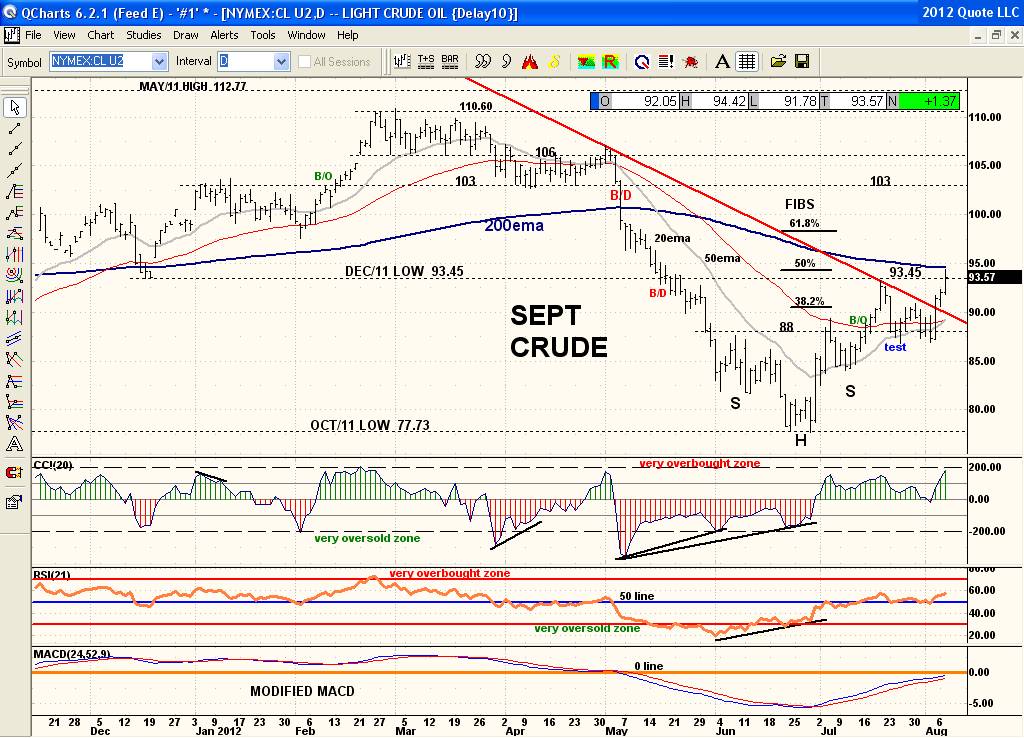
Yes the drawdowns are something that can really screw your head up despite being very close in 'time' to a low point. Guess that's why the old saying is 'Price is King". But the double bottom at the Nov/11 low would have been a good technical entry point as double bottoms tend to give at least a dead cat bounce back. What I see now as per my last post was price at a major resistance point in price and the techncials are at a critical turning point of a breakout or failure. See price back off from this Dec breakdown point resistance and close basically right there. That is not a breakout and if price rolls over here so will all the technicals. The 20ema will then just kiss the 50ema and curl back down and remain below the 50ema which is below the 200ema so therefore bearish. AND the Modified MACD will do the exact same thing and tag the 0 line resistance and roll back down again and remain below the 0 line in bearish territory. Critical point right here. Price must clear AND hold above 93.45 to keep the technicals from rolling back down again. But notice in July when price ran above the 20ema and curled it back up again, price then came back and used it as support even before price broke out above the Inverse Head & Shoulder pattern. That often occurs before the chart pattern breaks out as price relative to the 20ema is faster than the patterns usually. But now price has also cleared that 3 month downtrendline which is bullish as well so this is a big test here. I don't track fundamentals as they are like a recipe that has its ingredients constantly change and often results in something opposite of what you expected. But from what I've come across, the fundamentals on Crude are very bearish. Not that I care but thought I'd mention that fwiw. I'll believe the chart as it will quickly react to whatever changes that occur. Meanwhile price also bumped up against the 200ema which often stops price in its tracks. (Strangles anyone?,lol)