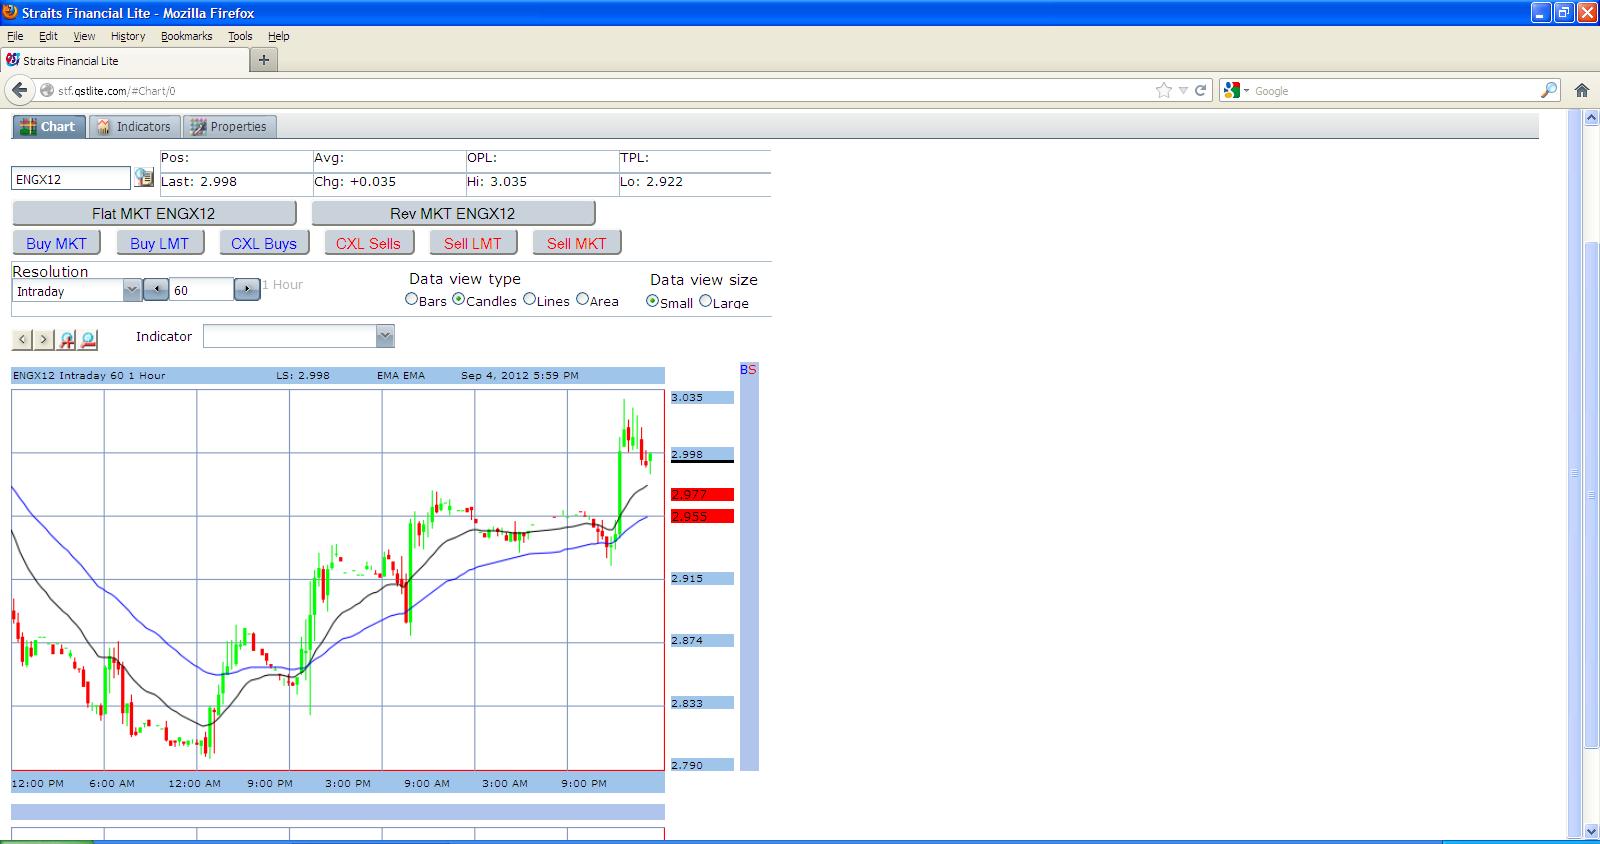
Well here is where we are at the end of trading today so far. On the 60 minute chart, certainly looks like could be a bullish flag\pennant to me that should
break upward. We shall see. The previous waves from 12:00 AM last Friday to the start of today look like a leading diagonal of some kind.
On smailer intraday charts basically a 5,3,5,3,5 and correction until the breakout today. That is "usually" what happens after a leading diagonal.
Today at least showed some follow through in terms of the formation of a bullish looking flag as opposed to a complete collapse back below
2.92. The above is my bullish position. Also on the Monthly chart, the MACD histogram has crossed up above the zero line. Stochastics have
been up for a month or two now. The Weekly Stochs have looked to have crossed Up now. And weekly MACD is pointing up and never really
did cross down during the current downtrend since 3.40 Daily is still in upmode as well. So ALL time frames are in upmode in terms of all
"momentum" indicators.
However, on the opposite end, the moving averages bands and the DMI/ADX which are my two favorite "Trending" indicators, have not given any confirmation yet
of a trend change to the upside. The down does look like its weakening based on momentum. The latest upmove could still be part of a final correction of the down
move since 3.40 (all november basis btw). And a resumption of the downtrend to come. Again, the "trend" indicators need to go now to confirm.
Im still in the Bullish camp though with more calls than puts because at this point, all 3 timeframes are pointing up in "momentum", indicating a change in trend is about to happen.
Good day!