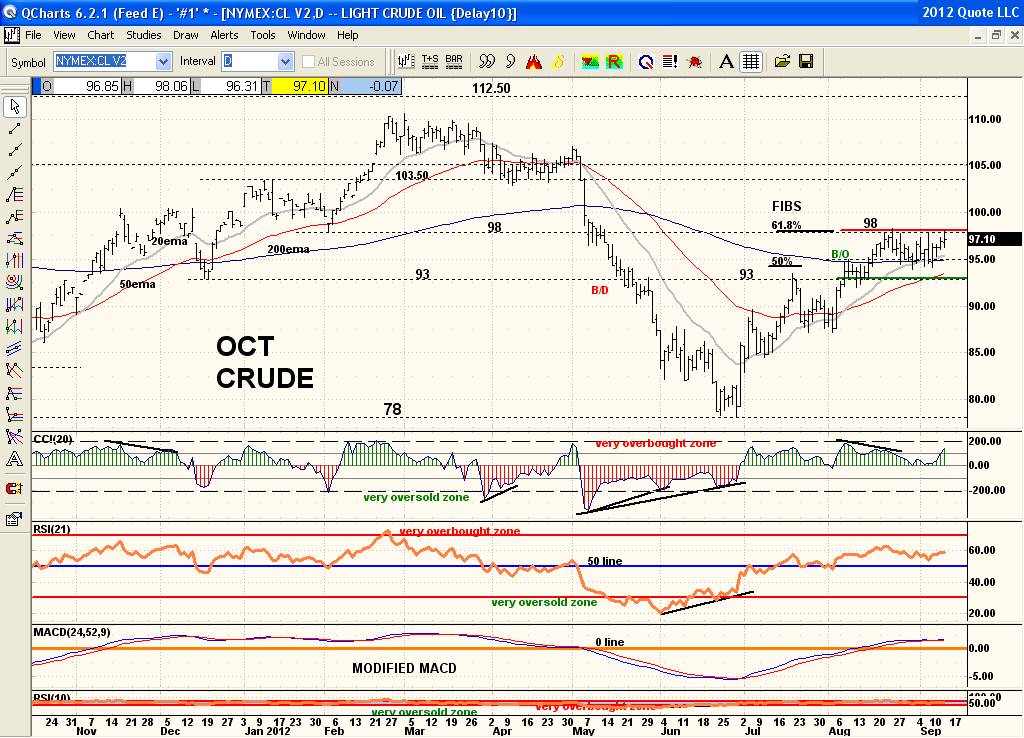
Oct Crude rallied to the Fib 61.8% retracement level in mid August. This was also strong price resistance at $98 which was the breakdown point in May and showed weakening technicals at the time. Price now is stuck in a 1 month channel between $93 and $98 but typically still riding its 20ema which is bullish. Closing and holding below $95 would be a warning of another test of $93 support but only closing below $93 and holding below would confirm a significant selloff. Breaking above $98 and holding would be very bullish and suggest a run to $103.50. Historically seasonal trend charts show Crude topping out in September and selling off right into December. At the same time the rising price action from June to mid August and now the sideways channel of the last month tends to breakout on the upside as channels are "Continuation Patterns" that breakout or breakdown in the direction of the previous price direction 75% of the time. And clearly the previous price direction since June has been up. Bottom line: Watch $98 and $93 for a breakout or breakdown with an eye on $95 holding or not as well.