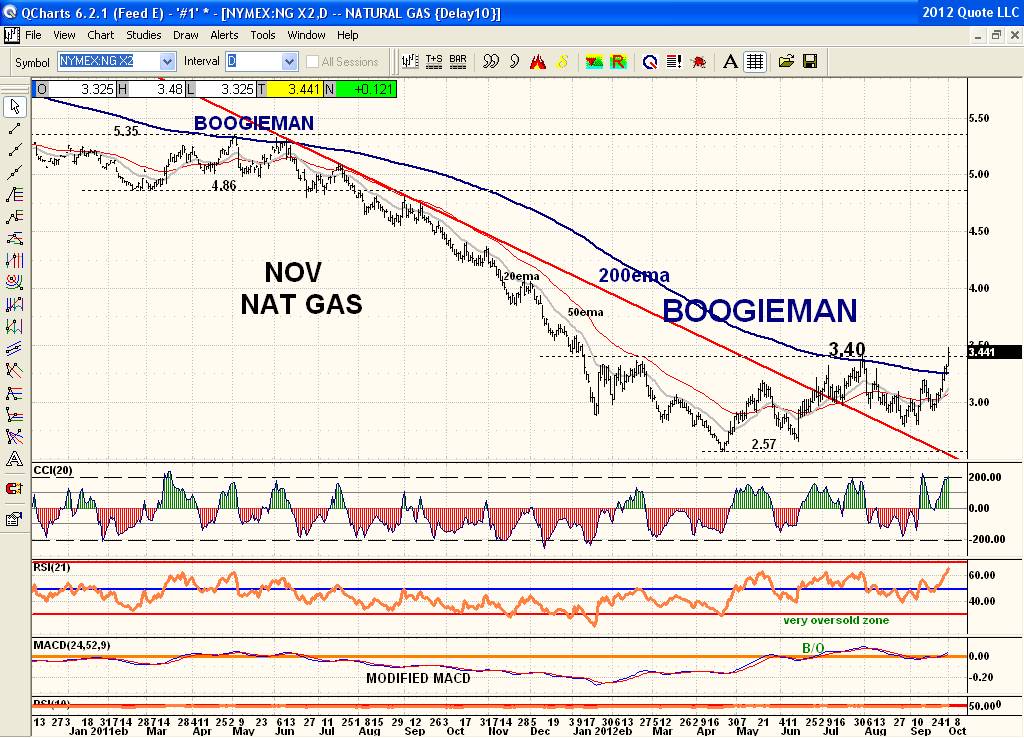
Well as far as Nov Nat Gas goes price is once again poking its head above the "BOOGIEMAN" 200ema. As you can see back in May/June/11 it did the same thing for a couple of months by a little and then threw in the towel and sold off again. The 200ema has been falling since July 2008 and needs to turn back up to confirm any serious and meaningful change to the upside. That will take price holding above the 200ema 'consistently'. NG has been base building pattern this time for months now and just chopping around within its base. Today price is 'attempting' to clear major resistance of 3.40 with a nose poke above this resistance level. "IF" price can "clear and hold" above 3.40 NG has a chance of breaking out of a multi month base and turn up once again. Until that is clear NG is nothing more than an intraday scalp trading vehicle both ways. Nice to see the Modified MACD clear the 0 line and hold above that line since June. On the short term note the CCI 20 tagging the very overbought zone of +200 where price often reverses back somewhat. Bottom line: Watch to see if price holds above 3.40. Seasonal trends (if you can pay much attention to the NG seasonal trends with extreme supply issues) shows a low of the year in early Sept and a rally to the end of Oct historically. Then a selloff through to mid November and another rally from mid Nov to mid December.