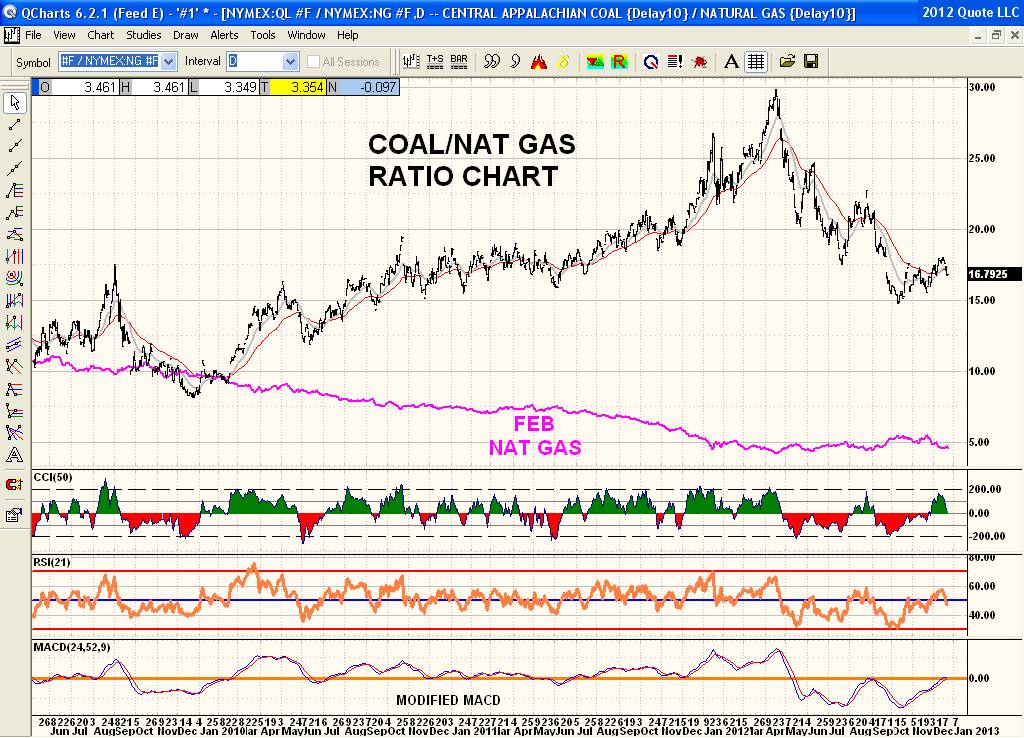
Here is this Coal/Nat Gas Ratio chart I posted once before. As they say when Nat Gas gets above $3.5 to $4 it is no longer viable to switch from Coal to Nat Gas. So you see Nat Gas prices breakout over short term resistance and run up to about $4 and then pullback and even break down again a couple of times now. That is the reality of both as one directly competes with the other. Notice NG bumbling along its bottom and basically good for day trading at best. What is notable is see the Ratio chart and its big swings up and then down that actually "TREND" both ways for long tradable periods of time. Bottom line: This Ratio chart is also a "Spread Trade" that can be put on either way and actually see some serious price action rather than trying to trade a bear market that is trying to base build against insurmountable odds due to its overwhelming over supply and the Coal market it is directly competing with. Just thought you might want to see this again. Also notice the Contango with Nat Gas which indicates no demand anytime in the near future.