I made this chart earlier in the year. Enjoy.
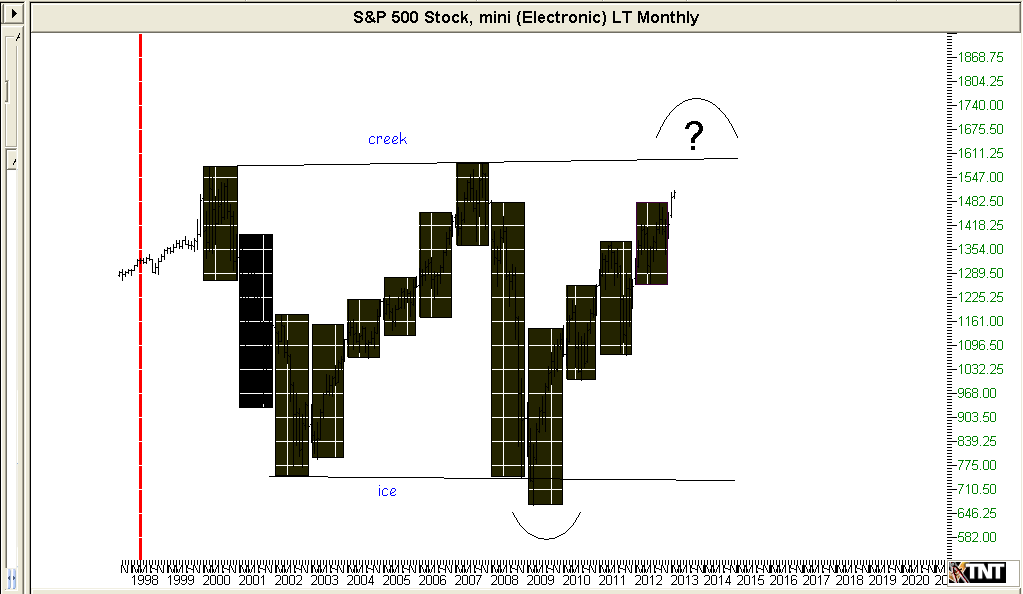
A home made yearly chart out of a monthly (a tad crude but it's the best I can do). What can we learn?
I see a large TR with creek (resistance) 2000 / 2007, ice (support) 2002 / 2008. What if 09 was a spring?
Spring... a penetration below a previous support area with no significant price weakness, price immediately
moves higher above the support area.
With the 2011's mid range close I thought we had a 3 bar correction at the time. The 08 bar wiped out 5 years
of work in one bar. One would anticipate further weakness correct? Well 2012 didn't break so we have to 86
that idea & think maybe at a minimum an UT is a possibility or triple top?
Upthrust - a sharp price movement above a prior support level which does not hold, but immediately reacts below
that previous level (spring in reverse).