Chapter 10
Pattern & Market Correlations
“Because all markets are related, they impact each other, making them all interdependent just as in our human social relationships”
Dr. Bill M. Williams
Author of Trading Chaos
"While it is important to know the collective pattern of an individual market, it is also important to know how the majority of major markets or economies are collectively aligned. Before you decide which markets to trade, it is a good idea to know how that market relates to other markets. The direction of the impulse moves that determine the scales in all financial markets are influenced by the patterns of the more heavily traded “alpha” markets which reflect current central banker policies, investment conditions, and the global business cycle. The patterns of low yielding currency pairs, where the countries are all implementing similar Keynesian policies, or commodities that can be substituted, can generally be compared to planets taking their cue from the larger stars, such as the S&P 500 with its blue-chip dividends and huge global footprint, or the Australian Dollar pairs with their hefty, margined yields, or the EURUSD, or USDJPY with their huge economies and powerful central banks.
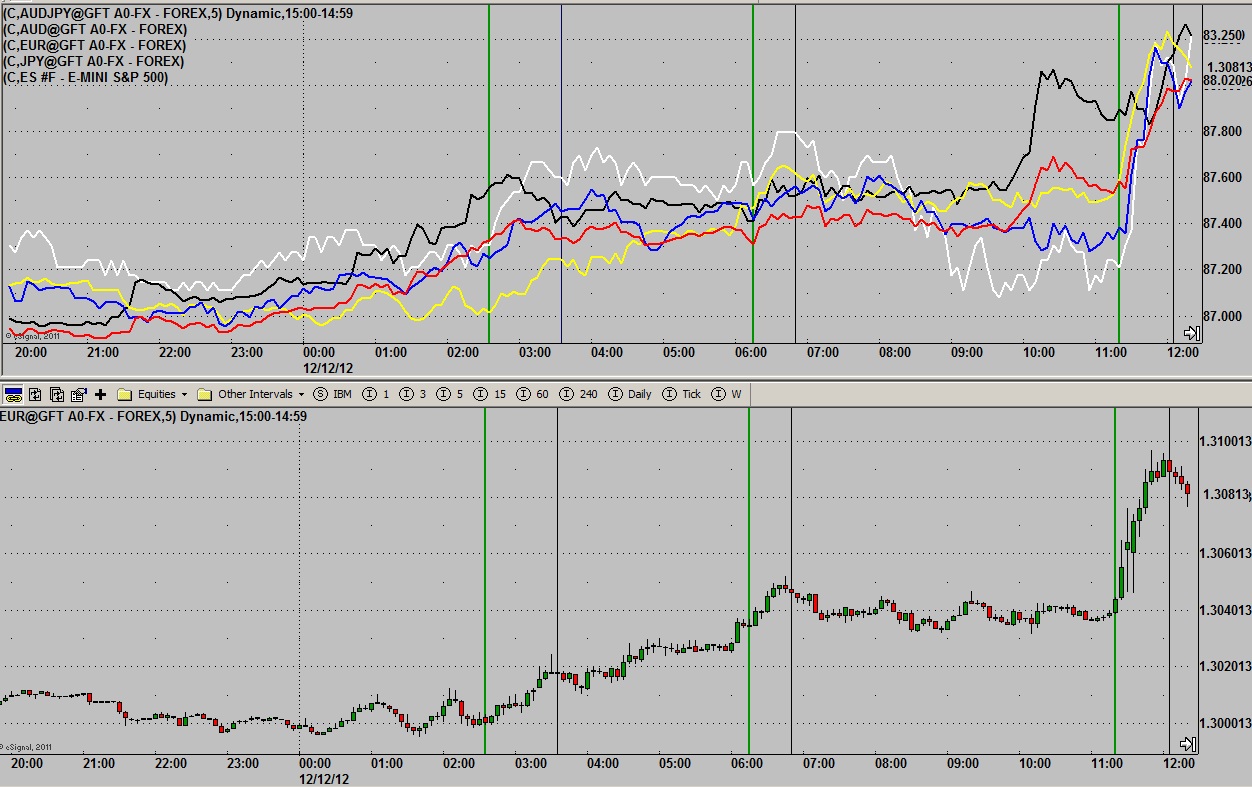
Many of you have already heard that markets spend more time in sideways, counter-trending markets than not. This is true. Markets spend over 70% of time going sideways. For the majority of time markets bump along in apparent haphazard direction with stocks going down, and Aussie going up, and Euro going sideways, or vice versa. When we see this directionless state for the financial markets we have an idea that both collectively and individually the markets are counter-trending. The chart in Figure 11 highlights this behavior. The top panel in Figure 11 is a line chart of AUDJPY, AUDUSD, EURUSD, USDJPY, and the S&P 500 future, while the bottom panel is a candle stick chart of the EURUSD. We marked out those short periods of time when the markets were aligned and moving in the same direction. It was less than 30% of the time. Those times when prices were not aligned on the top panel, price bumped along in lackluster sideways trade. Those times when markets did align however, that is influential markets such as blue-chip stocks, and major currency markets start pulling together, we saw trending behavior. When price correlations are strongest is when markets exhibit the largest trending moves; when correlations are faltering however markets produce counter-trending price action with the different market groups such as blue-chip stocks and carry currencies moving counter-to each other. This behavior is fractal in nature meaning it does not matter which time frame we observe it on.
Figure 11. Trending Moves Occur When the Majority of Major Markets are Aligned
In the graphs in Figure 11 we are making the point that we get the largest “trend” moves on the bottom chart, EURUSD, when the 5 markets on the top chart are aligned. This is a normal dynamic. When the markets in the top chart are bumping along counter-trend to each other – which is the majority of the time, the euro, on the bottom panel shows sideways directionless trade. Once the 5 markets align – the macro picture --and move in the same direction, trending price action occurs for the individual market – the micro picture.
When you see currencies and stocks trading counter to each other you need to be cautious because these markets are more liable to see directionless sideways trade. When all the markets are aligned however – carry pairs, stock indices, ETF’s – we are more likely to see trending price action. When we are in a trending environment we want to spend more time on the screen waiting for trade set-ups in-line with the collective pattern because it is easier to be profitable in a market showing a sustained, repetitive cycle, than one showing lackluster sideways trade. Many traders want to believe that they should be able to profit in all environments, any day of the week. We know from experience that there are greater profits to be had when markets are aligned because there will be bigger price moves. Likewise when markets are grinding away counter to each other is usually a good time to go fishing, or enjoy a nice lunch".