I often refer to the collage of markets in the chart in Figure 1 as the most influential macro chart on my screens. The chart highlights that we get the largest moves when the markets are moving together, and also highlights which market is in the alpha position, which is extremely important for intraday trend traders and for short-term momentum traders. At the beginning of the week all markets had turned lower together, which is uncommon. Generally the markets take turns dropping off and correcting lower one at a time, much like a flock of geese changes leadership with each adult taking a turn flying point while the previous leader drops to the back of the flock and drafts as all the birds continue forward. Observing this tendency over time helps in determining which markets to trade for a given day or week. It helps us to see which markets are producing trend trades and which counter-trend trades, which will influence trade management - tighter stops and smaller profit targets for counter-trend trades, or looser stops and wider profit targets for trend trades. Following the gold sell-off on Friday, 4-12-13 through Tuesday, 4-16-13, all four markets briefly turned lower together, which while uncommon, in hindsight did not seem unusual given the amount of exposure institutions and individual investors had in the gold market and the stress and margin calls this sell off in gold set in motion --undoubtedly that would have spilled over into the other markets.
Figure 1.
We teach traders to not buy into moves of individual markets unless they are in the same direction as the majority of markets. Yet we are also always aware of not fading the alpha dog. Over time the U.S. stock market in the form of the S&P 500 has been the alpha market. Since late last year however USDJPY is competing for that role, and this week seemed to usurp it. The alpha's direction is key because it gives us a heads up as to where the money is flowing. As short-term trend or momentum traders we don't trade the right or wrong of Keynesian policies, or political influences, we trade price. At the end of the day all that matters is not losing money - and as a wise trader once told me, if you can eliminate the losing trades the winners take care of themselves. As is so often the case, eliminating the losers means saying "no" to counter-trend trends. That chart is so important because it shows us exactly what the markets are doing, and over time has taught me an extremely important lesson which is "believe what you see". Regardless of what I might think, hear or read, at the end of the day there is no denying what the markets themselves did. For us the pattern of the majority of financial markets represents the collective pattern or trend of the overall market, just as Risk Tolerance Threshold Theory teaches that the majority of patterns in an individual market represents the collective pattern, or trend of that market. The only trading belief we need to harbor outside of trusting price is that the patterns price creates are a reflection of current fundamental determinants. If whatever is influencing price the most changes we will know this immediately because price will shift along with it. This also explains why an estimated 95% of financial futures volume comes from short-term traders. It is more profitable to shift along with the markets than to have the market shift against you. No longer can traders count on being in the right place at the right time in a mean reverting environment, such as many of us enjoyed on the trading floors for so many years in the 90's and 00's. Markets are too large and central bankers have taken on a much more influential role over the past decade.
Back to the chart in Figure 1, and what it is telling us, we definitely need to be more aware of how influential the Yen has become because it is proving itself to be a bonified alpha market. USDJPY quickly stabilized throughout the week and led U.S. stocks higher on Friday. While the Aussie continued to press lower, it did so without the support of the majority of markets. The 1.0275 level in AUDUSD is very important and held for 3 day in a row. A close below that level however likely opens up this pair to further losses given it will shift the Day to Day pattern bearish, which would be significant if you cover/trade only the Aussie, but less so if the Alpha markets USDJPY and S&P 500's continue higher.
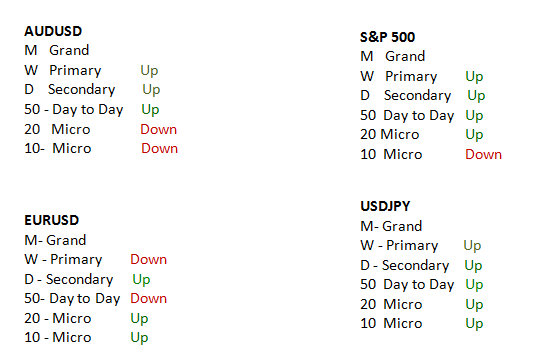
Figure 2.
For our money however we still cannot green light sell signals in these four important markets in the chart in Figure 1, not just because of the all-important collective pattern, but because of the price patterns of the individual markets in Figure 2. The Risk Tolerance Threshold Ratio in Figure 2 is a great tool for recording the different time frame patterns, or trends, that make up the collective direction, and is another reminder for traders to believe what we see…and not what we think, hear, or read.
Jay Norris is the author of the best selling The Secret to Trading: Risk Tolerance Threshold Theory. To see Jay highlight trade set-ups and signals in live markets go to Live Market Analysis.
Trading involves risk of loss and is not suitable for all investors.