The key to staying on the right side of the market is in knowing how to collate the different tradable patterns in that market. Contrary to what many educators teach it is not "top-down analysis" which counts, but identifying those times when the majority of patterns are aligned.
It is widely taught in technical analysis that the higher time frame trends exert the most influence on today's prices. We now know this to be not entirely true. In today's market place where a full 95% of financial futures volume is day traders, the Primary or Secondary patterns are not nearly as influential as the Day to Day pattern. (The Day to Day Pattern is a reflection of the day to day news events which are influencing the market) Likewise a lower time-frame pattern, such as the 10-day pattern can be the most influential of all, if a shift on that time-frame means a shift of the majority of patterns, and particularly if that shift is in-line with that all important Day to Day Pattern
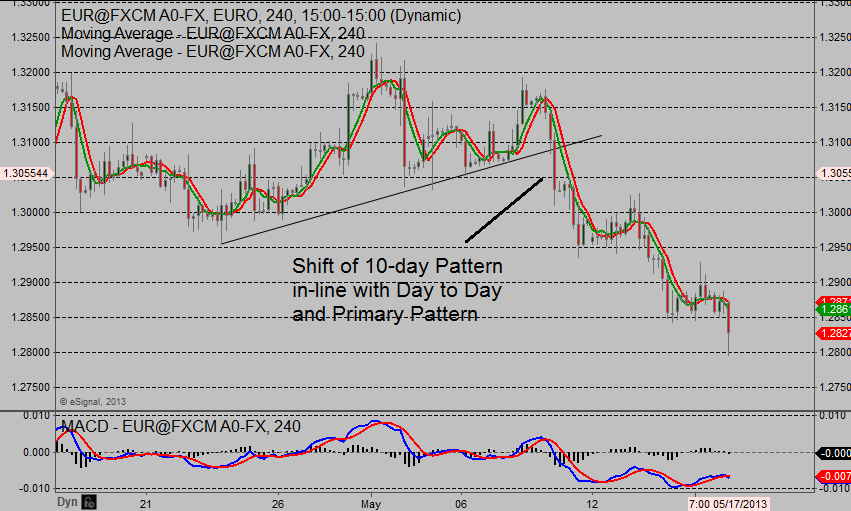
Figure 1. 10-day Pattern shifts bearish, in-line with Day to Day and Primary Patterns.
The Flap of the Butterfly's Wing
We call when a short-term patterns shift turns the entire market place the "the flap of the butterfly's wing" in deference to Chaos Theory which postulates that when a series of events of varying degrees of significance experiences a confluence which supports the next higher scale development, this can set off a chain reaction. Theoretically something as insignificant as the breeze created by the flap of a butterfly's wing in South America can over time cause a tornado in the U.S. Midwest. As random and incomprehensible as this may initially sound, scientists are now discovering that it is quite true that slight changes on a minute level can have out-sized effects to entire market places. While the butterfly is not the easier example to envision, the same dynamic plays out in market moving news all the time.
Often times it is headline news which has very little effect on market movement, while it is a barely seen quip by an economist about the ECB buying securitized small and medium sized business loans that prompts an influential trader to add to his Euro shorts because he sees a policy shift. The other traders see the alpha's action and follow suit. The selling forces prices to close below a level that bank analysts see as significant, which prompts them to sell to hedge their own exposure. As the circles widen, the selling increases, and at that point it does not matter if the economists quip was correct or not. What matters is does that alpha trader add or cover ahead of the weekend?
Figure 2. Risk Tolerance Threshold Ratio for EURUSD on 5-17-13
But from our perspective none of this matter's a wink because we know over time the market will get it right, and the price patterns we see on the chart will absolutely reflect the underlying fundamentals. To identify the different patterns we use a Risk Tolerance Threshold Ratio, or RTT Ratio as seen in Figure 2. All that matters for us is we know when market patterns shift, and most important when that individual shift also shifts the collective pattern, because that is the secret to forecasting markets.
Multiple Time Frames Trading & Fractal Geometry
In mathematical terms a price shift can be referred to as iteration. Technically iteration is the repetition of a sequence of operations geared toward a result. Theoretically that end result in trading would be a price point that the maximum number of participants find agreeable. Realistically that result will never happen because of the dynamics of the fundamental underlying structure of the marketplace, which is the business cycle, and the emotions of individuals. Just as economies ebb and flow and individual business' come and go, markets cycle up and down in trends or waves. The only thing we know for sure is that price will surely change, or shift, and the next trend or pattern will play out again, and again, and again. Knowing change will occur emphasizes the importance of being able to define the where, when and how of that change, or iteration.
Because the nature of fractal geometry is that each successive internal, or lower level, is just a slightly more complex version of the previous external, or higher level, that larger time frame construction will appear more simple. Our arm looks relatively simple; it's one appendage and has three major joints, or iterations to it, while the smaller hand is more complex in that it has 5 minor appendages with each one having 3 joints each for a total of 15 iterations. Similarly a longer-term chart has less iterations, or trend shifts, than a shorter-term chart. Likewise the more short-term you drill down the quicker the iterations will occur. The when, and how of trend shifts is the same on a monthly chart as a 1-minute chart, but because they occur much more often on the 1-minute chart and we are seeing a much larger number of them, the variation gives us the appearance that they are more complex. Those same variations also insure that a computer program will oscillate between being too early and too late to identify that shift. It is true that by knowing the when and how of pattern shifts, that given the time you can take advantage of them on the short-term time frames for as long as you can maintain your discipline and focus. It is also true however, that given we all have to sleep, and generally have lives outside of trading that we will find it much easier to trade lower time frame charts in the current direction of the higher time frame patterns. In other words we take our marching orders from an influential pattern such as a Day to Day pattern, more the better if it's aligned with the primary or secondary pattern, and look for actual trade signals on a lower time frame charts when those signals are in-line with that pattern and the majority of patterns.
To see Jay Norris highlight trade set-ups and signals in live markets on the London / U.S. overlap every Monday and Thursday go to Live Market Analysis http://trading-u.com/eCampus/courses/live-market-analysis-trial/. Jay Norris is the author of the best-selling The Secret to Trading Forex, Futures & ETF's: Risk Tolerance Threshold Theory
Trading involves risk of loss and is not suitable for all investors.