We like UUP which is an exchanged traded fund that tracks the U.S. Dollar Index for a variety of reasons, one of which is the rate of economic growth in the U.S. relative to competing economies around the globe. The gross domestic product, or GDP, of a nation or region is widely considered its economic standard of well-being.
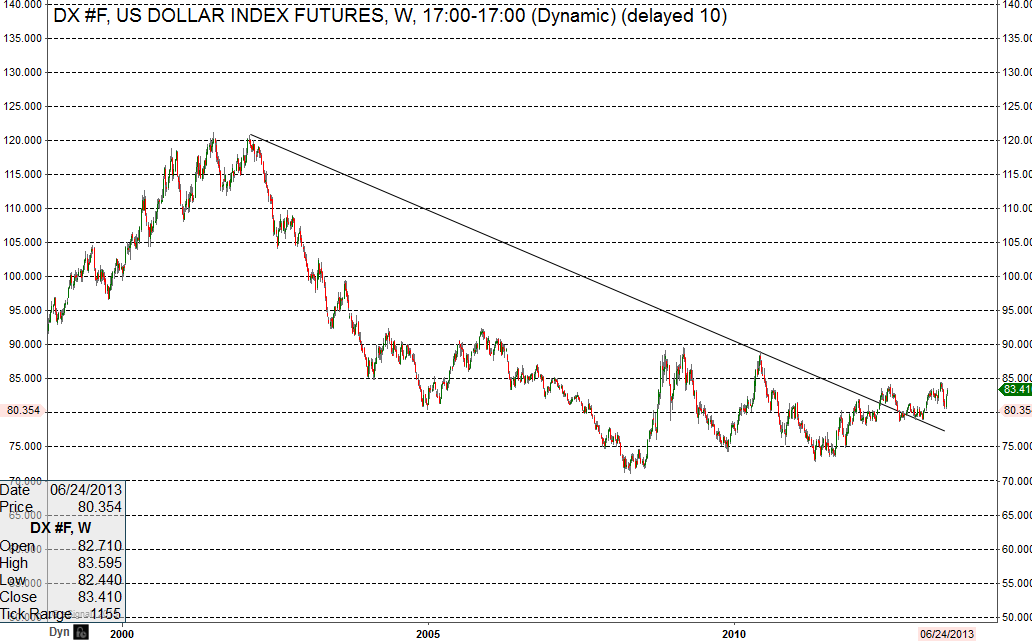
Here is a list of the current GDP levels for the major countries with freely traded currencies. followed by a monthly chart of the U.S. Dollar Index in Figure 1.
United States GDP +1.8%
Japan GDP +1.0%
Australia GDP +0.6%
Great Britain GDP +0.3%
Canada GDP +0.1%
Europe GDP -0.2%
(click to enlarge)
Figure 1. Monthly U.S. Dollar Index Chart
While many of us in both the U.S. public and private sectors would like to see a gross domestic product upwards of 2 to 3%, when compared to the growth rates of our trading partners, the U.S. at just below 2% is not bad at all. Given trends in global growth tend to be entrenched, and take much time and effort on behalf of central bankers, business leaders, and politicians to shift; it seems likely the U.S. will stay the leader on the list of least slow growth.
Continued slow global growth also lends itself to softer demand for commodities, a trend that is already making headlines in 2013 with the continuing collapse in the price of gold, and now lower agricultural prices. And just as rising commodity prices equate to a weaker U.S. Dollar, as it takes more dollars to purchase the commodities, falling commodity prices mean a stronger U.S. Dollar. The cyclical nature of commodities and their inverse relationship with the U.S. Dollar makes a strong case for a historic shift higher for the Greenback, just as it made a strong case for a bear market in the U.S. Dollar starting in 2002-03.
The bottom line: we like the prospects for going long the U.S. Dollar Index, or UUP, over the coming years.
Jay Norris is the best selling author of The Secret to Trading: Risk Tolerance Threshold Theory.