The long-term primary pattern for the Euro versus the U.S. Dollar is bearish with the Euro having retraced less than 2/3rds of the 2011-2012 bear market - see Figure 1. It is a tenet in Dow Theory that a market can retrace up to 2/3rds of an impulse move and still maintain its overall pattern. That 2/3rds retracement level in the Euro intersects just below 1.40. Until we see successive closes above that level on a weekly basis the long-term primary pattern remains bearish.
Pattern
The study of market patterns is so important because they are a reflection of the dominant underlying fundamental events at that time. And the underlying fundamentals of the bearish pattern in Figure 1 is that the U.S. economy will emerge stronger than the European economy as the global business cycle picks up steam, thus directing more capital into U.S. assets and investments then European.
(click to enlarge)
Figure 1. Euro Weekly Chart December 2013
The Difference between Trading and Investing
One paradox of trading, unlike investing, is that the majority of the time the long-term primary pattern is not significant to traders. In today's markets, where a full 95% of financial futures volume is attributed to day-traders, patterns longer than 25 to 30 business days start to lose their significance. The only time long-term structure is relevant to traders is when price is in close proximity to it. That structure, or in the case of the Euro, that resistance just below 1.40, takes on added significance when price is close to it and there is a significant economic occurrence. Time and price are in confluence with the event. This is what we are seeing now with the Euro approaching 1.40, and the U.S. Fed starting the inevitable wind-down of its quantitative easing policies which started nearly 5 years ago. We see this confluence as an opportunity for investors and a potential pitfall for inexperienced speculators and traders.
Another Paradox
Another paradox in trading is demonstrated in the current Euro rally. While the wind down of QE is one of the most anticipated events in the history of modern markets, those that have already positioned themselves to take advantage of it are actually fueling the Euro's ascent with their short-covering - buy stops. In trading being early is far worse than missing the boat. Those who have sold short the Euro in anticipation of an uptick in interest rates as positive economic data in the U.S. guides the tapering of quantitative easing, are finding that market speculation is riskier than they thought - this is the potential pitfall we see for traders. It is this paradox, which supports my own philosophy that it is far more important for a trader to be able to quantify how a market moves, rather than qualify why. In other words, I am not as interested in the causes of market behavior as in the effects.
Risk Tolerance Thresholds
One major effect that we see time and time again is how speculators underestimate their own risk tolerance in the face of monetary losses. They are correct in their overall analysis, but early because of their perceived certainty of the outcome. It is not speculators who are wrong in their assumptions that fuel the last leg of a market move before a major reversal, but speculators who are correct, but who have allowed their emotions to get them into positions too soon. For them 1.40 in EURUSD becomes a risk tolerance threshold level. When price hits that price they will have reached their maximum point of pain, and will capitulate, i.e. buy in their shorts, just as they did in October when the Euro peaked at the .618 retracement level of the current long-term primary pattern. This is exactly why 1.40 will prove an excellent point to hedge long Euro exposure as well as a potential historic top in the market for investors.
Back to Pattern
There is another powerful pattern at play in markets which is the seasonal pattern. The reason we can count on patterns is because they are not just a reflection of current underlying fundamentals, but also a reflection of human behavior, which is after all what really drives markets.
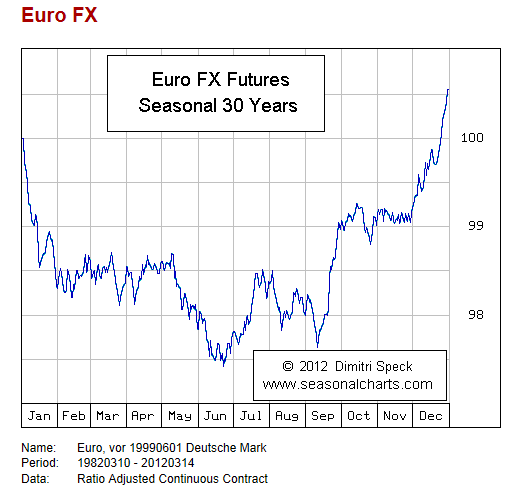
(click to enlarge)
Figure 2. Euro Seasonal
We know of no other financial market seasonal reversal as pronounced as that of the Euro on January 1. Just as September through December is an excellent time to be long the Euro, January is the best month on a seasonal basis to be short.
Tie everything together from the current long-term price pattern, to the economic environment, to the short-term activity -- short squeeze -, to the seasonal, and the New Year is shaping up to be an interesting one for Euro market watchers!
Jay Norris is the Director of Education at Trading University and the author of The Secret to Trading: Risk Tolerance Threshold Theory
Trading involves risk of loss and is not suitable for all investors