Most of us are familiar with static analysis, which is defined as either fundamental or technical analysis as measured up to a particular point in time, i.e. previous market behavior. It is our static analysis that provides a directional bias - ideally a statistic based bias - be it a premise or assumption based on economic data (causation analysis) or price pattern. Yet once we have determined which market and direction to take a position in, how should we go about timing the entry, the management, and the exit of the trade/position when price is constantly revaluing itself based on new incoming news?
This is where dynamic analysis plays an important role. Static analysis defines the underlying economics of a market up to that point, and/or that market's preceding technical environment and behavior, while dynamic analysis involves analyzing the market's evolving stance. It is important that you have a method or framework which gives you a definitive measurement of direction right now so you can see when market behavior is deviating or confirming your static analysis. And that tool needs to be dynamic, i.e.: it evolves as the market changes.
An example of combining the two forms of analysis would be you have identified a down-trend in a market, and you are focusing on selling a rally in that down-trend - you are following a classic tenet of trading: sell rallies in down-trends or buying dips in uptrends. When price actually rallies - the set-up -- you need to switch to dynamic analysis -- and perhaps a lower time frame chart -- and wait to see if price does start to play out according to your plan. You need to monitor the market for a short-term change in direction and/or a shift in momentum in favor of your analysis before risking/committing to the trade. The static analysis identifies the set-up - the direction you are looking to trade in, while dynamic analysis - price behavior - supplies the actual trade signal. Figures 1 & 2 provide an example of such a trade following the March release of the U.S. employment numbers last Friday. On the first chart we have highlighted the bearish effect on the market of the news release and marked out a box that we zoomed in on on the 2nd chart.
(click to enlarge)
Figure 1. Static analysis of Euro following news release
(click to enlarge)
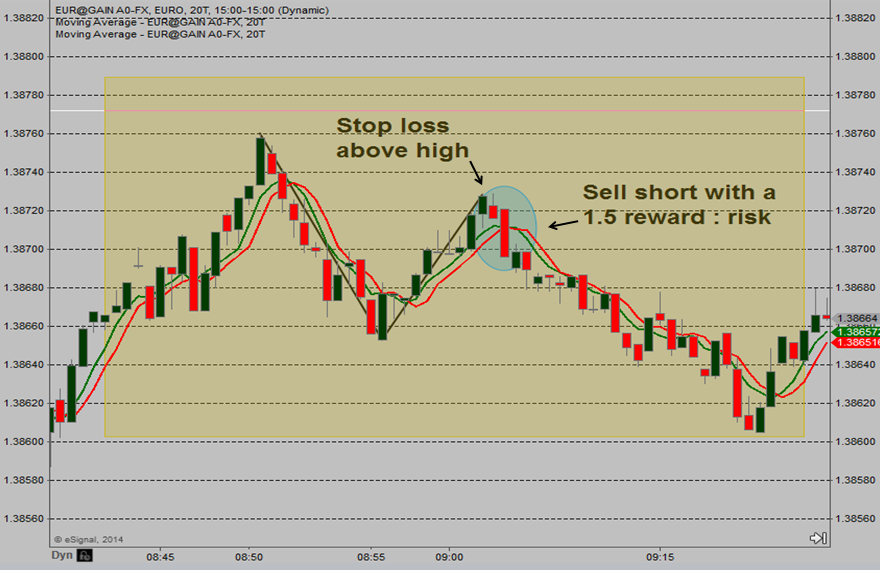
Figure 2. Dynamic analysis on lower time frame chart after the news release
Given the manageable risk on the trade in Figure 2 the profit target was reasonable and more important reachable. For a video explaining that trade in greater detail go to: YouTube / EuroTrade
Because dynamic analysis must evolve as price moves though time it will have to include market generated information which has the advantage of being fact based. Using "market generated information" means using only inputs or information provided by the market itself; for example using a market's high, low, and closing prices in your analysis. Using such specific information has the advantage of being easy to quantify when it comes to performance, and risk. In Figure 2 the reward on the trade is based on the risk with both being a function of real time market behavior. The advantage is you know ahead of time how much you are willing to risk, and the process lends itself to repetition which means we can accumulate statistical data. Price will always change - which is not always so with our own views and opinions.
Many professionals already use dynamic analysis of price in the timing and management of trades, and more still are moving toward it for trade selection - previously the realm of economic fundamentals, i.e.: causation analysis. The one thing we can count on when it comes to market movement is change, which leads us to believe that dynamic analysis of price action - studying the effect of market movement rather than the cause -- is where tomorrow's traders want to be focused.
Jay Norris is the best selling author of "Risk Tolerance Threshold Theory" and a trading instructor at Trading University
Trading involves risk of loss and is not suitable for all investors