Apr 10, 2014 12:11 PM
Given the correct map, the appropriate tools, and adequate supplies what appears to be the most difficult of journey's can be simplified.
Environment
I have been emerged in competitive environments my whole life, and the one component of success that individuals overlook the most, which also happens to be the most important, is environment. You can have the best attitude on the planet, and lead the healthiest lifestyle contributing to an above average energy level, but if your efforts are not aligned with that of the environment you are operating in you are going to struggle. Likewise if your actions are aligned with the environment - i.e.: being in the right place at the right time -- less effort will reap greater rewards. Once you see the validity of this you realize how important "environment" is to investing and trading. So many traders believe their focus should be on competing with other companies or individuals in the market, and overlook the importance of definitively identifying whether they are in a bullish, a bearish, or a counter-trending environment, and then focusing on tactics that are supported by that environment.
Pattern: The Fundamental's Footprint
Technical analysis, or pattern recognition, involves identifying the current stance of a market, be it bullish or bearish or neutral, that the current economic environment has created, and looking to position ourselves to take advantage of that stance. Likewise we can also use reverse engineering to determine a market's stance by just observing which patterns and trade signals are being rewarded and trade along with them. The philosophy behind technical analysis is the belief that the pattern on the chart is the effect of fundamental news and information. By focusing solely on the effect of price movement, or specifically "how" price moves rather than "why" we open the door to an age-old market study which uncovers far more predictive behavior than we otherwise would see from focusing on the cause of market movement.
(click to enlarge)
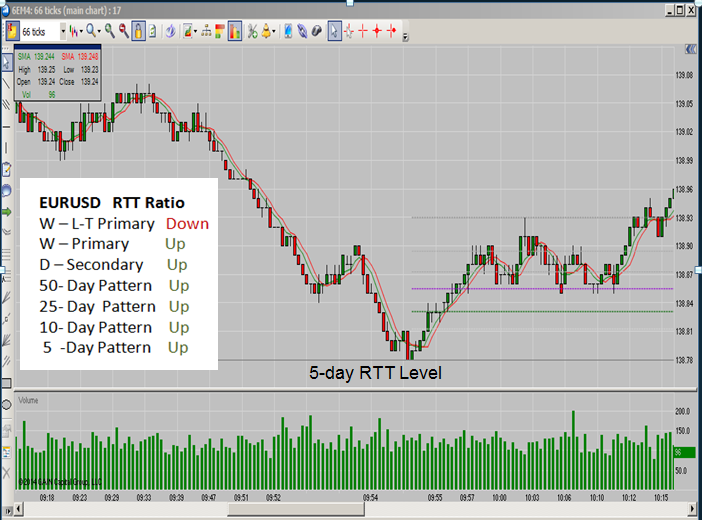
Euro futures tick chart from 3-18-14
An example of this predictive behavior can be seen in Figures 1 thru 3, which are intraday snapshots of the euro over 3 consecutive days. For the first two examples the Euro was in a bullish environment as measured by its tradable patterns - meaning we would only focus on buy signals (trend trades), while in the third example the market was in a counter-trending environment. The Risk Tolerance Threshold Ratio, or RTT Ratio, over-laid on each chart measures whether the different tradable time frame patterns are bullish or bearish. To determine which direction to trade from, we take any three consecutive patterns and take signals in-line with the majority of those three patterns. The majority of patterns determine which trade is a trend trade versus counter-trend trade. Depending on which three consecutive patterns we chose to trade can mean we are taking both buy and sell signals - i.e.: we are seeing both sides of the market -- as was the case in Figure 3.
(click to enlarge)
Euro Forex tick chart from 3-19-14
What stands out in these examples is the market produced the same formation each time: a higher low in the form of a double bottom on a 50% retracement following a test of our Risk Tolerance Threshold Level - the RTT level is a specific retracement level which delineates whether a pattern is bullish or bearish that is based on Dow Theory.
(click to enlarge)
Euro Forex 3-minute chart from 3-20-14
Focus on Effect not Cause
The three charts highlight a remarkable characteristic about markets. Their movement or behavior is predictable when you remove causation from your analysis! These three charts represent three days in a row where the market produced nearly identical formations with identical results - winning trades - at approximately the same time of day!
Seeing fish in the lake however and catching those fish are two different things, as are correctly analyzing a market and successfully trading that market. What you may have noticed about each chart is all three are different time frames ranging from a 40-tick chart to a 3-minute chart. If there is one thing teaching in live markets nearly every day over the past 5-years has taught me is we have to adjust to the speed of the market and not the other way around. There is no doubt markets are fractal in nature meaning they exhibit self-similar behavior on the highest time frames on down to the lowest time frames. When that truism hit me it opened the door to being able to see the remarkably simple and predictive way in which markets move on the lowest time frames. But before I saw that, I had to believe it could be true. Thank you Dr. Bill Williams and Benny Mandelbrot!
When we look at a price chart we often see what we want to see, which is why it is so important that you are able to categorize each time frame pattern you analyze as being either up, or down. Or better yet have an agnostic indicator such as a retracement tool to make that simple determination for you.
To see Jay Norris highlight trade set-ups and signals in live markets during the London/U.S. overlap go to: Live Market Exercise. Jay is the author of "The Secret to Trading: Risk Tolerance Threshold Theory".
Trading is a risky endeavor and not suitable for all investors