Re: S&P et al... *PIC*
I knew I did this when I did it but failed to correct it. The previous chart linked to above in the "In response to link" is a weekly chart. Everywhere I said daily or day convert it to week or weekly...it is after all a weekly chart. Whoops.
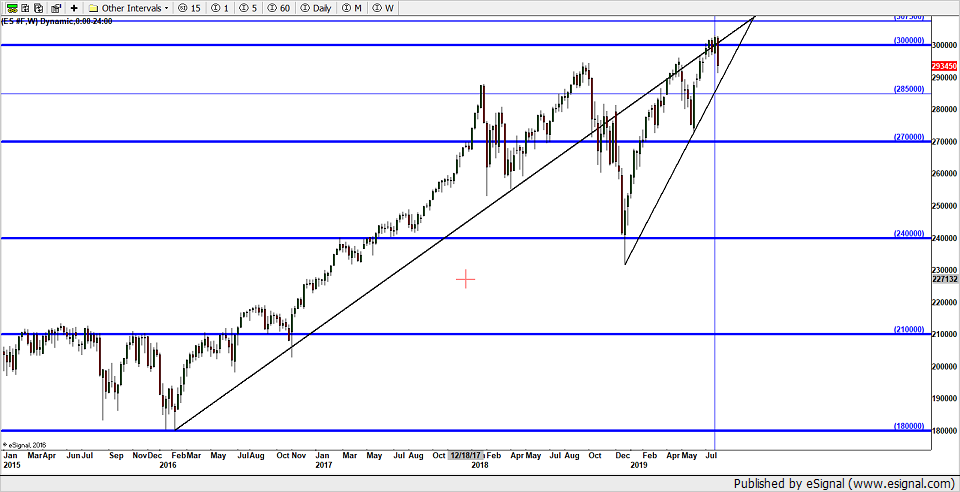
Here is the updated chart. It eventually, from linked chart posting time did make 300 but failed to really break it. it just hoovered around 3. Never really settled above it in a convincing way, it just churned around it. Finally on week 181, getting past the 180 time cycle and into a new cycle it broke below 30 last week on week 181.
people are panicked...well..the perma-bears, always looking for a top and having called the top on this last 180 week up move at least 180 times, will be in high pitch until it breaks above the last high...at which time they will call another top.
Perma-bears are like the broke clock...they'll eventually be right. Truth is, it's still in a strong bull market on the weekly and the monthly. Could it grow into a longer term correction? Could, but it's got some work to do. Hell, it hasn't even made it back down to the 285...halfway between the 30 and the 270.
Anyway...here's the updated chart showing time break at 180-181 weeks...weeks, I say, as it is a weekly chart. ha!