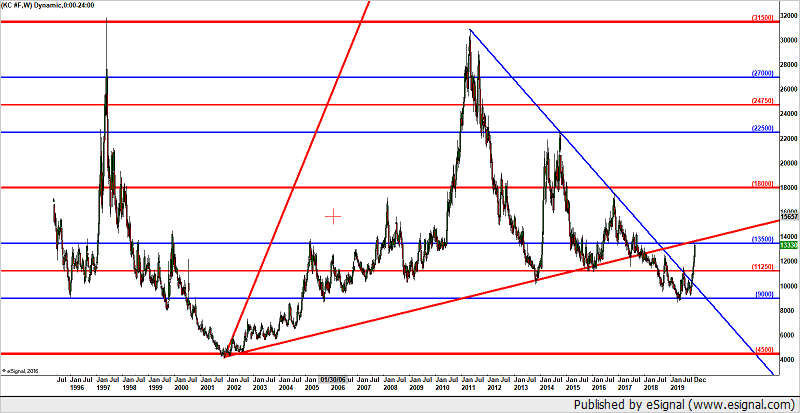
weekly chart. The KC seems to be a square number follower. High 315 low 45...both numbers derived by division of circle by 4. 315-45=270. The red horizontals are the square numbers that represent the upper and lower limits of the long term range the quarter points and, of course, the 50% at 180. How nice of price to revolve around the 180 by 135 either way...up to 315 down to 45. A nicely laid out square number chart. The blue horizontals are also 4's but not divisions of the range.
The steeper red uptrend is up 90 in 90 a 1x1, the shallow angle red uptrend is up 90 in 900. A 1/10 variation of the steep one. A 1x10, more relevant for the times from that low in 2001, perhaps.
The blue downtrend is a down 90 in 45 a 2x1 derived from the monthly chart.
Linked this chart to one back in time where price had just broken a downtrend line. Thought it would be interesting to see if...as price just broke a shorter term downtrend...would price continue up. It has, but there were, what I would think would have been "got you out" machinations, before it did.
Next post a daily to show that.